on
Blog Post 6: The Ground Game
Hi everyone! We’re back this week with another set of models this time exploring the important concept of turnout. This week through building models using a measure of turnout, I’ve set out to investigate: How much does voter turnout actually explain election outcomes on average and does turnout benefit one party over another?
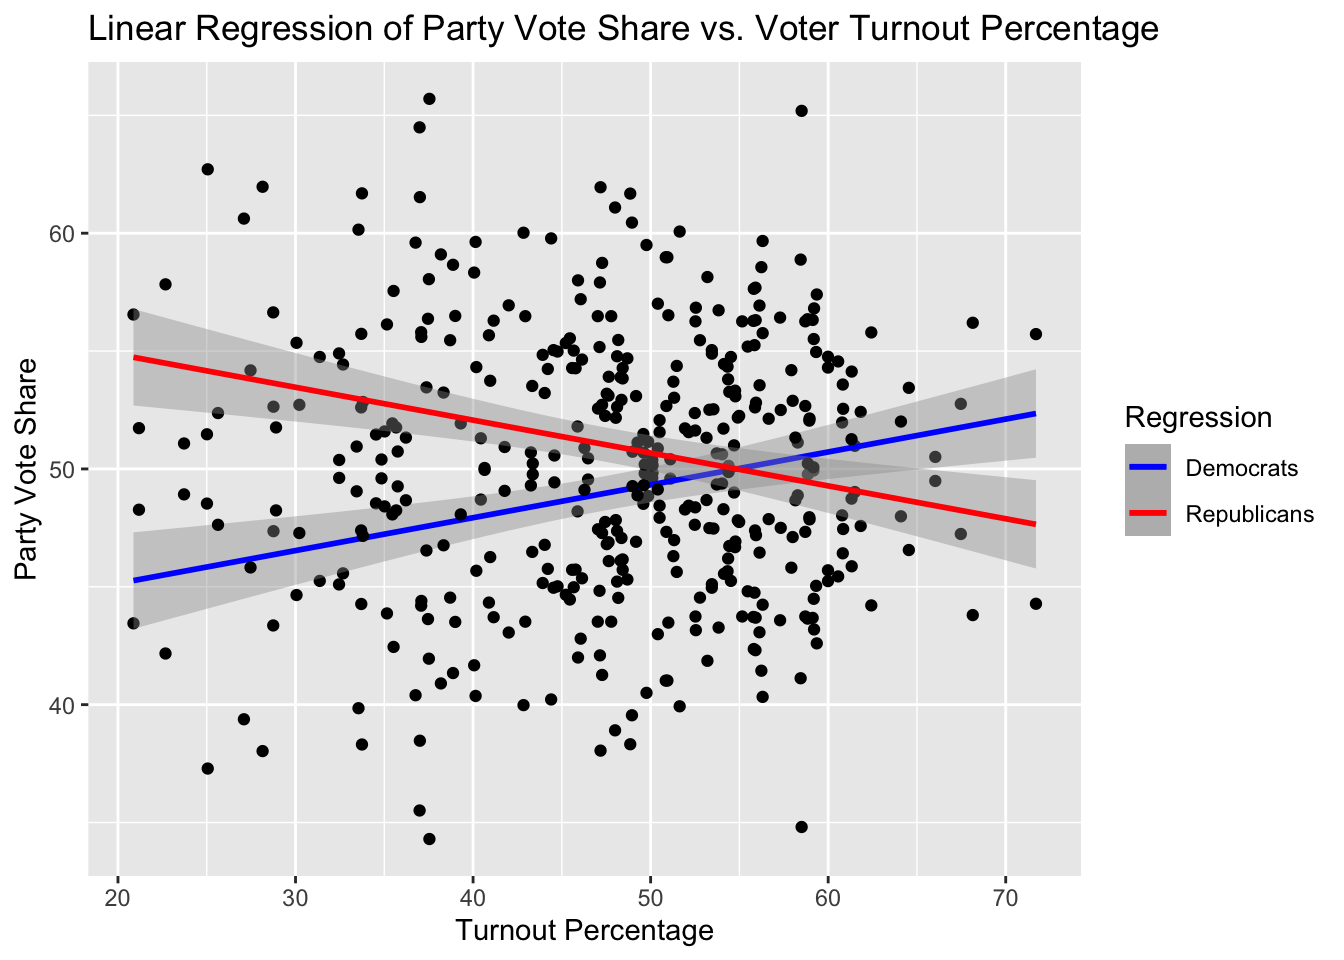
To begin looking at the relationship between party vote share and turnout, I graphed regressions of both the republican or democrat party vote share on turnout. The graph can be seen below. As pictured, the republican party vote share has a slight negative correlation with turnout while the democrat party vote share has a slight positive correlation with turnout. While the impact doesn’t seem incredibly significant, it seems that greater turnout is a benefit for the democratic party historically.
With a visible relationship established, I then moved on to think a little bit more about how I could incorporate turnout into a robust model. Recently, I’ve also been investigated whether a district level or national level model would be my best approach. So today, I will be creating both national and district level prediction models and evaluating each.
At the top of the model making process, I needed to decide what data to include in my train set. This week I tested out whether to train the data on all elections or just midterms but concluded due to literature’s remarks on the unique nature of midterm elections compared to one’s influenced by national votes as well. As such, I decided to subset the data to only train my models on midterm election years this week.
To look at trends in turnout and two party vote share percentage, I made models by progressively adding in different covariates. My first model is a simple model using turnout to predict Democratic Vote Share. The next model I created took this basic model and added in a variable for incumbency. I then created a model by including in average of expert predictions to the other covariates used previously. Finally, the last model I added in average poll support for the party in addition to all the previously mentioned covariates. This itterative process will allow me to see the importance of various variables and help me discern which are essential for my final model. The regression table can be seen below.

As can be seen in the regression table, the model that had the most predictive power on the data was not the model that included all covariates but the model that combined turnout, expert ratings, and incumbency. This model had an adjusted r^2 value of 0.772 which is certainly the highest of all models I’ve created in this course thus far. However, when I add in polling, this adjusted r^2 value decreased down to 0.757. This highlights that sometimes adding in all variables, especially ones that are likely collinear with others, may lead to overfit and not always increase predictive power. I believe this occured in my models because expert predictions likely take into account polling and thus adding in polling again just double counts that factor. As acknwoledged in weeks prior, the blackbox nature of expert predictions does make it harder to add in other covariates without knowing if they’ve already been incorporated. Therefore, to predict actual vote share in the 2022 election I’m going to use the 3rd model that includes just turnout, incumbency, and expert prediction. Looking at this model prediction, it can be seen that, similar to the scatter plot above, turnout has a small positive impact with Democratic Vote Share. When using this model to predict actual vote share, it can be estimated that using only midterm election years, the predicted Democrat Vote Share in the 2022 election is approximately 49.3689 and the predicted Republican Vote Share is approximately 50.4417.
In order to get a district level prediction, I took the prevailing model from my national level analysis and created a linear model to run on all districts. After building this model to predict Democratic Vote Share by looking at turnout, expert prediction, and incumbency, the model performed with an average r^2 value for all districts of 0.9549. This is the highest r^2 value I’ve seen in any of my district level models thus far. However, it predicts that the Democrats will win 53.49% of the two party vote share, which is much larger than my previous models. Finally, to conclude my inquiry I also made a district level prediction using a generalized linear model. This model also received a mcfaddens r^2 value of around 0.95 but yields a prediction that the Democrats will win only approximately 34% of the two party vote share. The variation in these predictions are somewhat concerning and will require more review to understand which outputs are most reliable. I believe the high average r-squared values are coming from the incredibly small sample size per each district in these district level models. Next week, I look forward to investigating this question further.
CITATION: Daron R. Shaw, John R. Petrocik. The Turnout Myth (Oxford University Press, & Glock, J. (n.d.). Does high voter turnout help one party? National Affairs. Retrieved October 24, 2022, from https://www.nationalaffairs.com/publications/detail/does-high-voter-turnout-help-one-party