on
Blog 10: The Campaign Narrative
Hi everyone! Welcome back to the blog! While I’ve spent the past 9 weeks focusing on how to predict elections and analyze forecasts, this week we’ve decided to culminate our studies with a case study: Pennsylvania District 8. Since analyzing numbers and regressions in the abstract oftentimes feels so removed from having consequence on anything meaningful in our political system, I’m hoping to contextualize our work. As such, I will start by telling the story of the race from district demographics to the campaign messages. Then, I will compare how the actual electoral outcome compared to forecasts for the race. Finally, I’ll concluded by analyzing where in the narrative I believe the forecast error came from and how this might inform future analysis.
DISTRICT OVERVIEW
Pennsylvania District 8 lies in the North Eastern section of the state. It’s comprised of parts of 5 counties: Lackawanna County, Monroe County, Luzerne County, Pike County, and Wayne County. Notably in the 2020 redistricting, parts of Monroe county were added to the district causing a reduction of the Republican lean of the district. The district contains 713,086 people with 78% of them White, 6.5% Black, 2% Asian, and is ethnically 12.8% Hispanic. With a median household income of $56,739 and a college graduation rate of 25.2%, Pennsylvania 8 seems to be a mostly white, working class district. Additionally, 6.9% of the population in the district are veterans (10% higher than Pennsylvania and US average) with an outsized portion of them being those who fought in Vietnam. Historically, this region of Pennsylvania is famous for having many “Reagan Democrats.” These are typically white, working class labor voters. Due to the former industrial nature of the region, these voters were union democrats who were fiscally liberal and socially conservative. While this is no longer the archetype for the region, the remnants of this ideology have prevailed in the region.
In terms of it’s partisanship, Pennsylvania District 8 is one of the infamous “Pivot Counties”. These are counties that voted for Barack Obama in 2008 and 2012 but shifted to vote for Donald Trump in 2016. Additionally, in 2020 this county also voted for Trump while putting in a Democratic Representative in the House. Taking a look at Pennsylvania District 8’s electoral history, the district appears to be a continual toss-up for the House in recent years and since 2016 has entered a unique phase of its electoral makeup.
Going into the 2022 election, the district seemed to have a Republican partisan lean on the whole. According to the Cook PVI, the district’s rating was Republican +4 signifying in the past two presidential elections the district voted four points more republican than the nation’s average. The Cook PVI wasn’t the only source to categorize the district as Republican leaning with Sabbato’s Crystal Ball also categorizing Pennsylvania 8 as “Leans Republican.” Oddly enough, while the district has had a Republican lean in Presidential elections since 2016, the district has continued to vote for Democratic Representative Matt Cartwright. In fact, it is one of only 13 district that voted for Trump in 2020 and chose a Democrat to represent them.
THE CANDIDATES
The 2022 general election for the House of Representative’s in Pennsylvania District 8 was between Democratic Incumbent Matt Cartwright and Republican Challenger Jim Bognet. The 2022 general election was in fact a rematch of the 2020 election between these same two candidates. As such, in the Republican primary, Jim Bognet, the Trump-backed candidate, defeated Mike Marsciano with ease and a 37.4 point lead.
To dive in a little deeper, Representative Matt Cartwright is a Democrat who’s served in the House since election in 2012. He originally served in Pennsylvania’s 17th district until 2019 but then was redistricted to the 8th district in 2020. Cartwright received his J.D. from the University of Pennsylvania and served as a lawyer for 25 years before going into public service. In 2012, he ran his first campaign to win a term in the House of Representatives. Since 2013, Cartwright is seen as a very moderate Democrat and has a reputation for working on bipartisan legislation. He’s served on the House Appropriations Committee and has introduced more bills with Democratic and Republican sepport than any other House Democrat since he was elected.
His challenger, Republican Jim Bognet has worked around government for a while. After receiving a J.D. and M.B.A. from UCLA, he founded a political and business consulting firm. In 2017, Bognet was appointed as a senior policy advisor to the Trump Administration to focus on small buisness support strategies and stimulating American jobs. Bognet got the Trump endorsement during the primary and during the election posed himself as a conservative who is staunchly against the status quo of the Biden administration and Cartwright.
With the background picture painted, it is clear that Pennsylvania’s District 8 was a contentious house election where predominantly white, rural voters were presented the choice between two candidates for the second time: Cartwright, the bipartisan Democrat of the status quo, or Bognet, a Trump Republican protesting against the actions of the Biden administration.
THE CAMPAIGN
Historically, people have said that Pennsylvania is a microcosm of the country and fascinatingly enough I’d contend that this district serves as a microcosm of Pennsylvania. Much like the over-arching national narrative of the midterms, this election was between moderate, incumbent Democrat Cartwright and a Republican challenger lamenting the status quo of Biden’s Administration and poor economic conditions.
In terms of economics, incumbent Cartwright had a significantly larger budget for his campaign than challenger Bognet. According to retrospective analysis done by OpenSecrets, 96% of House races in 2022 were won by the biggest spender, showing some correlation between budget and electoral success. In PA-08, Cartwright raised $4,942,885.51 and spent a little over 4.7 million. Meanwhile, Bognet only raised $2,464,603.32 and spent around 2.1 million (this data is only available from the SEC of 10/19).
Looking at messaging through the framework of Vavreck’s, Jim Bognet, as the challenger, utilized a clarifying campaign and focused on the economy more than any other issue. Specifically, Bognet aimed to tie not just Biden to the economy but his opponent and long-time incumbent Matt Cartwright to both Biden and the economy as well. In his about me page, Bognet utilizes the phrase “Biden-Cartwright agenda” multiple times, inextricably linking the two’s actions. Additionally, he harps on “the economic hardships brought about by the Biden-Cartwright agenda” and discusses his hopes to reduce spending, help businesses, and stimulate key elements of the Pennsylvania economy like energy production. Among the top 3 issues featured on Bognet’s site were “creating good jobs” and stopping the “tax and spending avalanche”.
Meanwhile, Matt Cartwright’s messaging was focused on one key element: bipartisanship. Representative Cartwright’s key tactic in this election was framing himself as a bipartisan who’s main goals are securing local interests. In the October debate against Bognet, Cartwright proclaimed himself, “the most bipartisan Democrat in Congress.” He even went as far to say he has a 77.1% similarity voting average with Republicans in the House. The Cartwright campaign understood the tenuous partisan dynamics at play in the district and instead pitched Cartwright as an established, experienced bipartisan who focuses not on ideology but on signing lucrative policies for the state.
In terms of candidate quality, Representative Cartwright definitely edged out John Bognet. Candidate quality may be defined by a few things but I’ll pose 3 important ones: prior experience, power and notoriety, and lack of scandal. While Bognet has prior political experience in the Trump administration, Representative Cartwright is a long term incumbent in congress since 2013. In terms of power and notoriety, Cartwright made a large campaign point out of his placement on the House Appropriations Committee. The power of the purse is one of the most significant in government and his attachment to such an esteemed committee was a big selling point for him. Additionally, being the incumbent he has broad name recognition and received most of the local official endorsements. John Bognet did have Trump’s endorsement, which is significant given the district’s overwhelming support for Trump in 2016 and 2018, however is less regionally established. Finally, while both Cartwright and Bognet have political histories to dissect, Bognet’s alleged scandal became a bigger talking point in the election. A Democratic super PAC launched an ad that hits Bognet for working at a political consulting company who helped the Saudis protect themselves from 9/11 related lawsuits. In sum, Cartwright’s history and powerful appointments in Congress helped him appear to be esteemed and electable while Bognet seemed to be trying to prove his credentials every step of the way.
Overall, the race between Cartwright and Bognet was contentious. Bognet aimed to rebuke the Democrat status quo that Cartwright represented while Cartwright worked tirelessly to rebuke partisanship as a whole and distance himself from a distinct Democratic party ideology. With the stage set for a fierce and close battle at the ballots on election day, a lot of eyes were on the contentious district 8 awaiting the electoral outcome.
**FORECASTS*:
On election day, Matt Cartwright received 51.25% of the vote share beating out Jim Bognet by 2.5%.
Since my officially submitted model was a national level model, I will compare the district forecast accuracy in parts: first, compared to my national level model and then compared to other expert forecasts.
Overall, my national level prediction had the Democrats getting 46.84% of the two-party vote share and have Republicans winning the remaining 53.16%. This was a significant overestimation of Republican chances as discussed in the previous election reflection. The Cartwright-Bognet election outcome is a great example of a race that defied my models prediction of a strong Republican swing. Accurately enough, forecasters did classify this race as a very close one and a tossup until the very end. Prolific outlets like FiveThirtyEight and the Economist disagreed on the winning party of the election, with the former favoring Cartwright and the latter Bognet. Below is a graph of the actual vote share outcome of Pennsylvania District 8, as well as the FivetThirtyEight district prediction, the Economist District prediction, and my national prediction along with the actual national vote share.
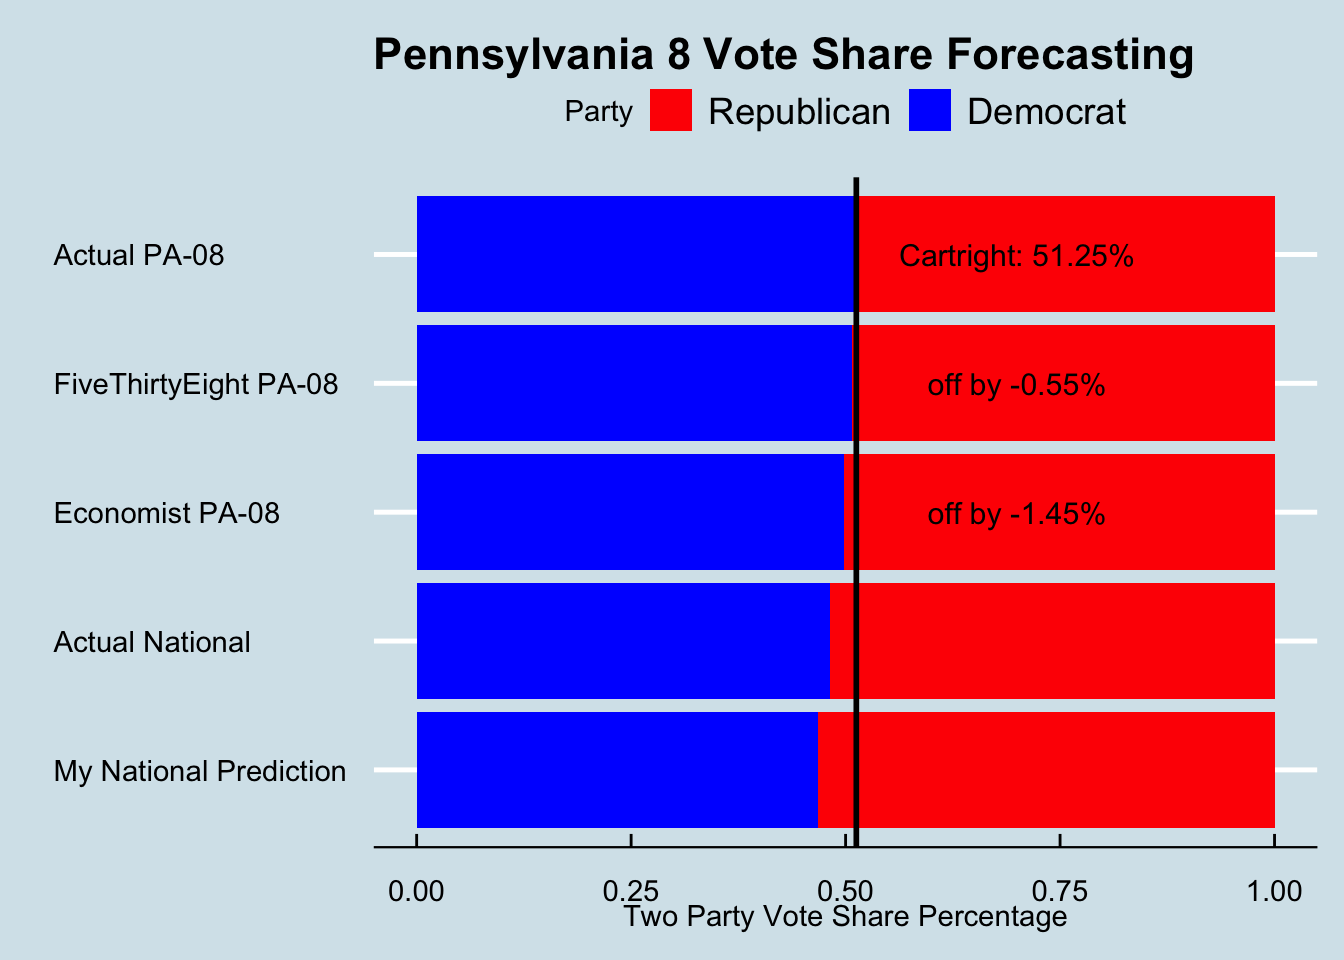
As can be seen in the image above, Pennsylvania 8 swung more democratic than expert forecasts expected and even more so than nation as a whole. From this it is clear that the Cartwright campaign out performed not just the tougher national climate for Democrats but also various model’s district expectations. While he outperformed forecasts only by small margins, the question becomes: How did Cartwright outperform a tough political climate and nearly all forecasts?
Conclusion
To start, Cartwright ran a phenomenal campaign that removed ideology and embraced the partisan dissonance of his region. Truthfully, his campaign along with his quality as a candidate allowed him to outperform dismal fundamentals for his party. While Cartwright was an incumbent democrat, his campaign emphasized bipartisanship so much that I hypothesize it nearly dissociated him from blame for the poor economic situation under Biden’s Democrat lead government. Strategically, Cartwright also visually demonstrated that one could hold Trumpian views and also vote for him. In a campaign ad, a Cartwright supporter urges voters to vote Cartwright while wearing a MAGA hat. This messaging transcends traditional party politics that Republican Bognet was counting on and hoping to engage with to seize the election. This campaign strategy diverged significantly from the national Democratic party messaging which emphasized progressive social values and attempted to motivate voters through calls to action against the warring ideology of the Republican party. I posit that the difference in strategy lies in the purpose of campaigning. In most races, the campaign is about motivating turnout and not about persuading voters to support one candidate or party. (Kalla and Broockman (2018)) (Enos and Fowler (2016)). Uniquely, however, in PA-08 the similar legislative priorities of both candidates and bipartisan nature of the district makes it plausible that many voters would in fact vote for either candidate and so campaigning likely had a rare actual impact on voter preference.
As such, while I have yet to test this hypothesis, I do believe that this may lead to the small amounts of forecasting error we see among expert predictions. Due to traditional theory like Kalla and Broockman, I believe most models choose to relatively exclude campaigning efforts and messaging from their models except in cases of forecasting turnout. However, Pennsylvania 8 has an unorthodox set of voters and electoral history that has proven time and time again voters are comfortable with candidates that pose favorable policies for the region like the case in 2016 and 2020 where they elect to have a Democrat Representative and Trump as President. A model that is not trained to look for persuasive effects of campaigns may in fact display error of the slight but significant margins seen with this years forecasts.
Another source of error may have been a lack of consideration for candidate quality. As discussed earlier in the campaigns section, Cartwright’s incumbency and local ties, as well as lack of scandal makes him a highly electable and reputable candidate. Meanwhile, Bognet’s challenger position required him to come across as more aggressive and his career in Washington made him vulnerable to attacks of being an outsider in the district. This compiled with the 9/11 related scandal left him looking as a slightly lower quality candidate. While this difference in candidate quality is frankly not large, it may also be able to explain the small sources of forecasting error from the district as it was proven to be a downplayed factor in forecasts nationwide.
Thank you so much for reading my election blog this semester. I’ve loved getting to think about how to approach new problems and how to represent different intricacies in our political system amidst my forecast. I hope today’s final blogpost contextualized the consistent quantiative forecasting work with the story and human element of campaigns that the models aimed to capture. I hope to keep following politics from this perspective in the future, in whatever form it may take me.
CITATIONS:
“Census Profile: Congressional District 8, PA.” Census Reporter. Accessed December 8, 2022. https://censusreporter.org/profiles/50000US4208-congressional-district-8-pa/.
“The Economist’s 2022 House Forecast.” The Economist. The Economist Newspaper. Accessed December 8, 2022. https://www.economist.com/interactive/us-midterms-2022/forecast/house/pennsylvania#8.
Enos, Ryan D., and Anthony Fowler. “Aggregate Effects of Large-Scale Campaigns on Voter Turnout.” Political Science Research and Methods 6, no. 4 (2016): 733–51. https://doi.org/10.1017/psrm.2016.21.
“Fact-Check of House Majority Pac Ad Criticizing Republican Congressional Candidate Jim Bognet.” Yahoo! Yahoo! Accessed December 8, 2022. https://www.yahoo.com/video/fact-check-house-majority-pac-072900976.html?guccounter=1&guce_referrer=aHR0cHM6Ly93d3cuZ29vZ2xlLmNvbS8&guce_referrer_sig=AQAAAKefvEjvMC0ulA7U24ZU5AdZVfUF7f6CiKoa1PD9xHoMFqD52ErkRUFIc8u1wOVWJG2yKKWNE9MUIt65v3zH3ySYYR5TsNxlPzOJ5VBGcyI3jVAv1L2GHMA_MQdUJWnBnxkRfvmVNk9BvJpm5qFDoOrJgDTFMDsqmSpBctVUt_2k.
KALLA, JOSHUA L., and DAVID E. BROOCKMAN. “The Minimal Persuasive Effects of Campaign Contact in General Elections: Evidence from 49 Field Experiments.” American Political Science Review 112, no. 1 (2017): 148–66. https://doi.org/10.1017/s0003055417000363.
Kang, Hanna. “Results: Democratic Rep. Matt Cartwright Defeats Trump-Endorsed Republican Jim Bognet in Pennsylvania’s 8th Congressional District Election.” Business Insider. Business Insider. Accessed December 8, 2022.https://www.businessinsider.com/results-matt-cartwright-jim-bognet-pennsylvania-8th-district-house-election-2022-11.
Oliphant, Baxter. “6. Quality and Responsiveness of Elected Officials.” Pew Research Center - U.S. Politics & Policy. Pew Research Center, May 30, 2020. https://www.pewresearch.org/politics/2018/04/26/6-quality-and-responsiveness-of-elected-officials/. “Pennsylvania District 08 2022 Race.” OpenSecrets. Accessed December 8, 2022. https://www.opensecrets.org/races/summary?cycle=2022&id=PA08&spec=N.
“Pennsylvania Eighth Congressional District Election Results.” The New York Times. The New York Times, November 8, 2022. https://www.nytimes.com/interactive/2022/11/08/us/elections/results-pennsylvania-us-house-district-8.html.
“Pennsylvania’s 8th Congressional District Election, 2022.” Ballotpedia. Accessed December 8, 2022. https://ballotpedia.org/Pennsylvania%27s_8th_Congressional_District_election,_2022.
“Pennsylvania’s 8th Congressional District.” Ballotpedia. Accessed December 8, 2022. https://ballotpedia.org/Pennsylvania%27s_8th_Congressional_District.
Silver, Nate. “2022 House Forecast.” FiveThirtyEight, November 8, 2022. https://projects.fivethirtyeight.com/2022-election-forecast/house/pennsylvania/8/.
“Spend Big, WIN BIG: 96% of U.S. House Races Won by the Biggest Spender.” OpenSecrets News, November 10, 2022. https://www.opensecrets.org/news/2022/11/spend-big-win-big-96-of-u-s-house-races-won-by-the-biggest-spender/.
Vavreck, Lynn. The Message Matters the Economy and Presidential Campaigns. Princeton (N.J.): Princeton University Press, 2009.
Ward, Myah. “The GOP’s Last ‘Candidate Quality’ Test.” POLITICO. Accessed December 5, 2022. https://www.politico.com/newsletters/politico-nightly/2022/09/13/the-gops-last-candidate-quality-test-00056533.