on
Blog 9: Election Reflection
Hi everyone! Welcome back to the blog. Election day is finally over and now it’s time to analyze what worked and what didn’t in my prediction forecast. To see the original forecast look here at my last blog post, but no worries if you want the TLDR as I’ll provide a quick recap below.
Model Recap
My model was a national level model that aimed to predict Democratic Two Party Vote Share from 5 variables:

- Average Expert Prediction Rating
- Generic Ballot Democrat Percentage
- Incumbent Democratic President Indicator Variable
- Number of Democratic Seats to Defend
- Turnout Percentage
The equation that followed model training became:

As can be seen above and will be discussed further, expert rating and generic ballot polls as well as democratic president in power are among the strongest coefficients in the model and thus played a large role in my election predictions.
From this formula, my election prediction was formulated finally on 11/7. My model predicted that democrats would win approximately 46.84% of the two-party vote share while Republicans will win 53.16% of the two-party vote share for the house.
At the 95% confidence interval, the upper bound of my prediction for Democrat vote share percentage was approximately 52.49%, while the lower bound was approximately 41.2%.
Accuracy Analysis
As of 11/28, the official outcome of the 2022 election was that Democrat’s won 48.14% of the two-party vote share and Republican’s won 51.86% of the two-party vote share. (reported by david leip) The graph of the actual vote share outcome versus my predicted vote share outcome is illustrated below.
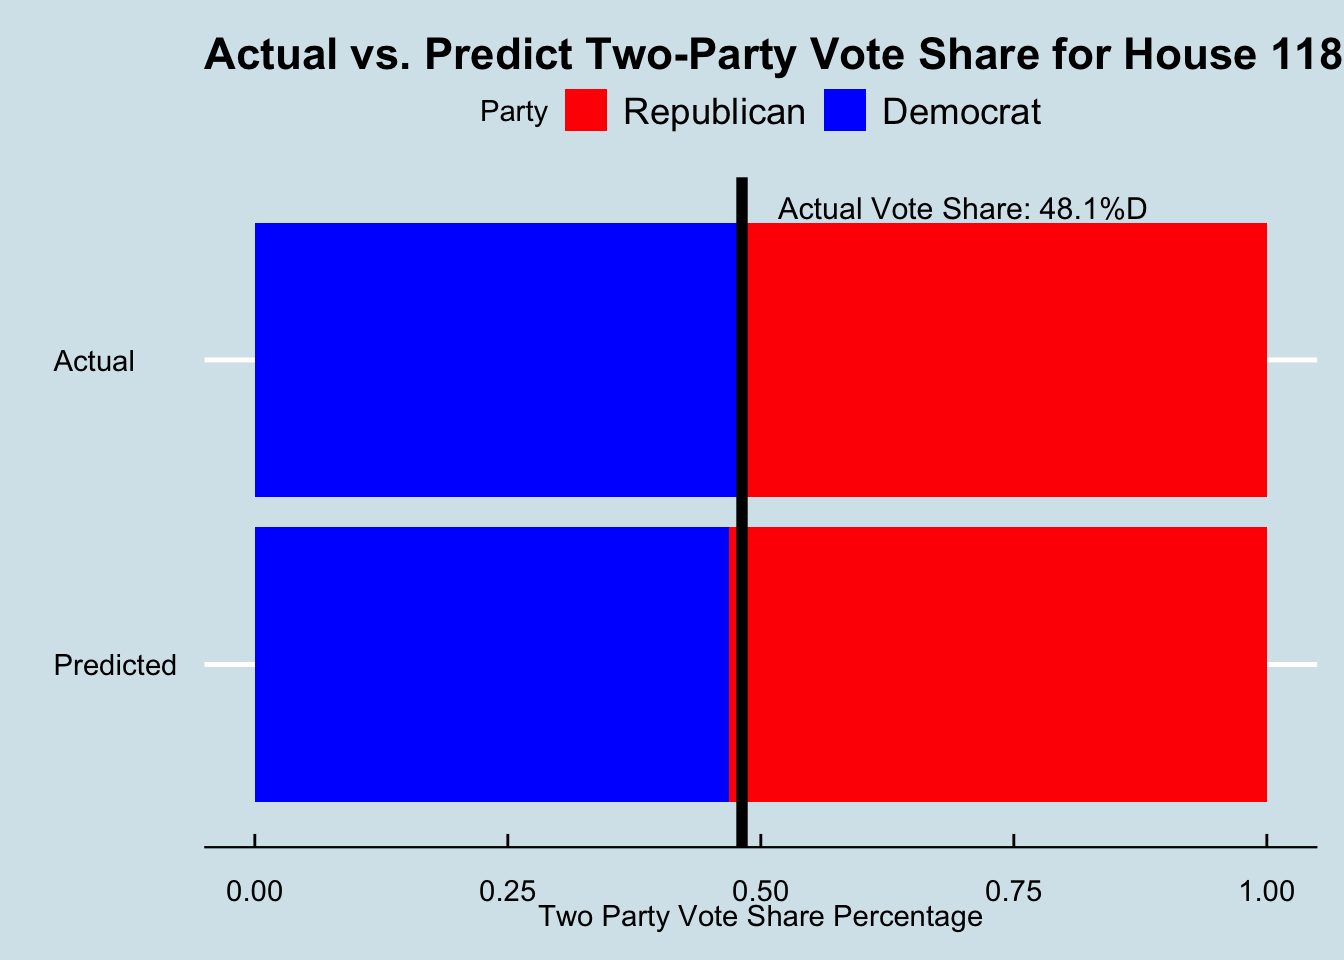
While this outcome did fall into the 95% interval for my prediction, looking at the graph it is clear that the outcome of the midterm was much more favorable for Democrats than my prediction expected. With the black line delineating actual democrat vote percentage, it can be seen that the actual vote share was larger for the Democratic party than my prediction expected. Doing the math to solve for residuals, there appears to be a residual of 1.3% with this model.
To compare this accuracy with other years in my training set, I chose to plot the actual vs. predicted democratic party vote share for each year in the train set and also the 2022 midterms. The graph of which can be seen below.
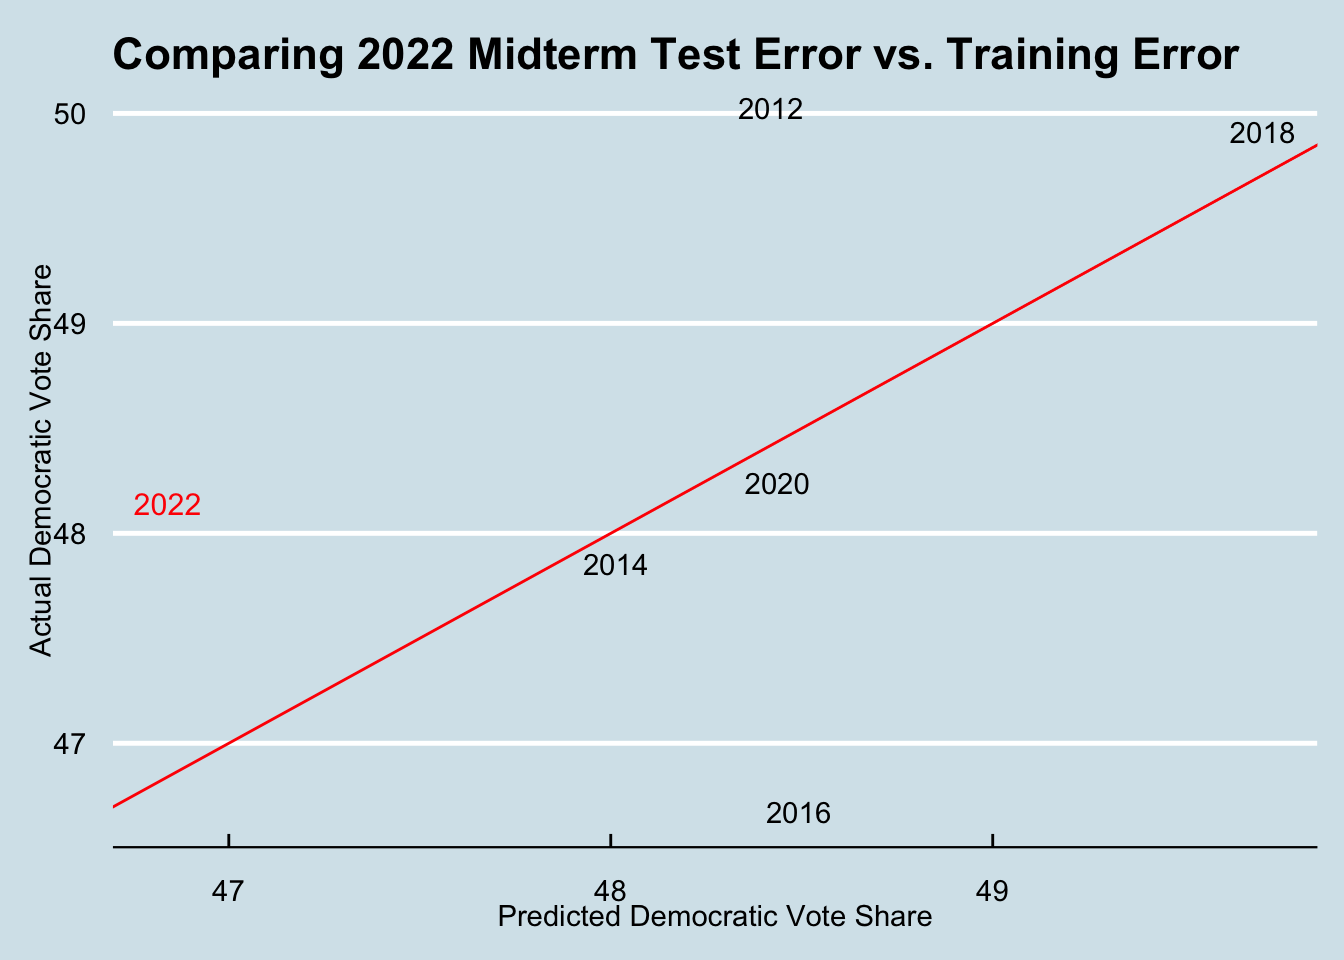
This graph plots the model’s predicted democratic vote share for a given year’s data while the y-axis is the actual outcome of democratic vote share for that election year. The red line represents the linear regression line of the model. As we can see, 2022’s actual democratic vote share outcome was certainly larger than that predicted from my model. Looking at other years, 2014, 2020, and 2018 fit the models’ predictions fairly well. Notably, for 2012 data my model wildly underestimated Democrats vote share while in 2016 the model significantly overvalued Democrats (2016 is likely due to significant polling error). For this reason, it seems that the model doesn’t seem to systematically overweight or underweight democrats but there are frequent accuracy issues. My next question then becomes, why might this be?
HYPOTHESIZING SOURCES OF ERROR
Overall, I think this model showed me a few key limitations of a national-level fundamentals model. In this section, I will break the major flaws into three larger themes: my national-level model oversimplified district level and state-level nuance which had a larger role in this 2022 election due to state level issues like abortion being on the ballot; my fundamentally focused model didn’t account for candidate quality and mutable electoral factors; and, more technically, my model’s data sparsity limited the set of data and biased it towards over-fitting on specific contemporary patterns.
Hypothesis 1: The national level model failed to capture district, state, and regional nuance and variation that was especially dominant in this 2022 election
My model is a national level model that aggregates data points across the country and takes national-level fundamentals to predict an overall outcome of the election. While there are some statistical advantages to this discussed in my prediction blog, I recognize in retrospect that this mode of prediction may fail in the dynamic federalist system we have today. Even more so, I think having a nuanced district or state level model was increasingly important in the case of 2022 when some of the biggest political concerns like abortion rights are happening on the state and regional level.
House elections happen at the district level and as such there should be district level variation. While overall trends definitely sweep the nation, voter behavior also depends on local attitudes and concerns. This election I think the abortion issue was incredibly salient but perhaps to varying degrees across districts and regions. Looking at my model in retrospect, a significant portion of the predictors focus on some of the immutable, fundamental elements of elections like incumbency and democratic seats up for election. While these are important predictors, what my model then leaves out is some of the more nuanced and dynamic elements that might influence the election. It is hard to remember sometimes that elections aren’t just about the political climate and composition but also about the issues people care about and the candidates running. After the overturning of Roe v. Wade in the Dobbs v. Jackson case, abortion rose to the top of voters minds. Abortion, no longer legalized by the Supreme Court, has become an issue on the state level and thus likely has different salience for voters in different areas. Additionally, voters who’s state governments are vehemently opposed to abortion legalization may be looking to get more liberal representation on a national level to angle for a federal protection. In exit polls, abortion and inflation were listed as the top two issues on voters minds during election day, with 6 out of 10 voters saying they were dissatisfied with the Dobbs ruling. Looking to the ballot measures passed in states recently, swing state Michigan and conservative Kentucky both saw turnout for supporting abortion protection. With an issue like abortion that’s divisive to different degrees on the state level, it’s harder to justify a national level model that assumes party sentiment is relatively uniform. My model incorporated generic ballot nationally, and only truly considered district level differences with expert rating.
Reflectively, this might explain why my model prediction overestimated Republicans. Since abortion is contentious in certain regions and uncontentious in others, it could be a major top-of mind issue in some regions but not a large voting concern in other regions. In places where abortion is a significant issue, my model would’ve underrepresented the Democrat two-party vote share since it is generalizing based on a broader national sentiment.
To test the importance of the issue of abortion and thus regional characterizations, there are a few tests I could run. One test I could do is test the efficacy of abortion as a voting issue in getting not just voters to register but voters to actually vote. One way I would do this is get a dataset from a company like L2 and look at voters who registered in the 2-4 week window after the Dobbs decision (making the assumption that this motivated voter registration). From there, I could match those voter files to voters that voted in the election. While this data isn’t available for all states, it is typically available for key swing states like Pennsylvania. This would tell me if abortion was a strong enough force to get voters to not just register but actually get to the ballot and vote for the purpose of supporting the abortion issue. Additionally, I would like to test how sensitive my model might be to district level predictions. If I took the same components of my model but instead tried using state or district level polling instead of generic ballot, I’m curious if I’d have a more accurate picture of the election and lower error. If this was true, then I could believe that my model was too attached to a national view of partisanship and attitudes and not as intune with more district level differences.
HYPOTHESIS 2: Focus on fundamentals failed to account for candidate quality
Another hypothesis I have is that my model may have dedicated a lot of space to partisan sentiment but didn’t take into account the quality of candidates running for each party, or their campaign strategy. In our increasingly polarized political climate, a lot of time is dedicated to analyzing political races as competition between two parties. Yet, focusing on this solely misses a key component of what it takes to win the competition: having good candidates. Senator Mitch McConnell lamented the lack of candidate quality for the GOP this election cycle. According to both Lynn Vavreck and Ryan Enos, candidates of high quality that run strong campaigns can outperform fundamentals. Perhaps, this election demonstrated that the corollary is also true: candidates of low quality that run week campaigns can underperform fundamentals. My model didn’t necessarily take this assumption into account as it primarily focused on fundamentals on the national level.
To test and see the significance of candidate quality in this election, I would like to create an index of candidate quality that evaluates candidates on key attributes like electability, experience in politics, personal qualities and attributes, scandal, popular platforms, and controversial or extremist positions. From there, I would like to insert this variable into my model and look at the predictive power and accuracy of predictions. This would allow me to see how additive a variable of this type might be to my model. However, I think this isn’t satisfactory analysis alone to see if excluding candidate quality contributed significantly to my error. I would also like to perform an analysis similar to one that FiveThirtyEight conducted for senate races this year. This test would us ethe partisan lean index to take stock of each district’s partisan lean and compare it with the performance of candidates in each district’s race. If candidates picked up points much greater or less than the districts inherent partisan lean, we can make some assumption that the candidate and the campaign they ran made up some of the difference in the race. In tandem, both analyses may yield some insight into how candidate quality impacted the 2022 election and how its exclusion from my model may have lead to inaccuracy.
HYPOTHESIS 3: My model trained on too few data points to be generalizable on new test sets
Finally, and perhaps the most statistically concerning element of my model, was how few elections and data points the model trained on. The model only had election years of 2012-2020 to train on due to a limitation of how far back I could obtain accurate expert predictions. Training on so few elections has the main drawback of preventing my model from being generalizable as it likely picked up on trends from the previous few elections rather than the majority of elections run in the US. Looking at the data it trained on, I’m not surprised that the model overvalued the fundamentals and incumbent party’s advantage. The model notably best fit data from the years 2014, 2018 which had elections with major swings from the presidential incumbent and a strong national sentiment consistent across all demographics. Since this is where my model performed best, I believe my model may have over fit and thus over-weighted the negative effects on the incumbent party.
To test the tendency for this model to over fit, I would like to compare the accuracy of the model on it’s train set versus accuracy on a validation or test set of data. Since my model does have a small sample size, I could pick any election year outside of the train data and test the model’s performance on this set of data. While empirically there isn’t a cut off for what is “over fit”, seeing a high reduction in accuracy in the validation or test set would illustrate an over fit model.
IMPROVEMENTS All in all, as you can see from the error hypothesis section, there are many things that may have gone wrong with my model. But, my biggest focus would be changing for two things: prioritizing district level data for district level predictions and amassing more data to train on.
While a national level prediction has some benefits in its ability to avoid the same data sparsity that often occurs with districts, I think a district level model helps capture some of the nuance that occurs with House elections. Especially in 2022, there are issues that have different salience in different regions as well as varying candidate quality. While a national level model allows for a generalization of partisan sentiments in the country, I don’t think these are the most representative of how voters think on election day since voters are socialized in a local and regional context and not just by national media. As such, if I were to stick with a national model, I would definitely try using district level polls or a partisan lean index as a baseline of a districts partisanship instead of the national generic ballot which only captures partisan sentiment on aggregate.
Additionally, I would want to overcome sample size issues that I had in this models train set. If I were to continue with a a national model, I would work much more aggressively ot either obtain expert prediction data for earlier elections or create simulated scores based on other election data from those years that I could find or imputing data from similar districts. That way I could overcome the sample size issue by going back more election years.
If I were to convert to a district level model (which I think is the best recourse), I would definitely try to solve the sample size issue using similar tactics to FiveThirtyEights’s CANTOR which takes data from similar districts and imputes it into districts with data sparsity. This would allow for significant increase in sample size and likely statistical validity.For much more advanced research, I would also look to seeing if there are applications where I could possibly generate synthetic data through simulation which is a new technique that’s caught the eye of the AI community. While this is a ways away from being ready, I think the field of election analytics could stand to benefit from the use of synthetic data since it’s a field that has unique constraints on sample size. (warning: synthetic data currently doesn’t allow for granularity that election analytics requires at the moment). Increasing the sample size will certainly help with the model’s generalizability on new test sets which is ultimately how we can improve perfromance in new tests such as the next election.
Citations
Ansolabehere, Stephen, and M. Socorro Puy. “Measuring Issue-Salience in Voters’ Preferences.” Electoral Studies 51 (2018): 103–14. https://doi.org/10.1016/j.electstud.2017.09.008.
Blake, Aaron. “Analysis | Why the GOP’s Popular-Vote Edge Hasn’t Translated to More House Seats.” The Washington Post. WP Company, November 15, 2022. https://www.washingtonpost.com/politics/2022/11/14/republican-popular-vote-seats/.
Graefe, Andreas. Predicting elections: Experts, polls, and fundamentals. Accessed December 5, 2022. https://www.sas.upenn.edu/~baron/journal/18/18124/jdm18124.html.
Moskowitz, Seth. “The Key to Forecasting Midterms: The Generic Ballot.” Sabatos Crystal Ball. Accessed December 5, 2022. https://centerforpolitics.org/crystalball/articles/the-key-to-forecasting-midterms-the-generic-ballot/.
Oliphant, Baxter. “6. Quality and Responsiveness of Elected Officials.” Pew Research Center - U.S. Politics & Policy. Pew Research Center, May 30, 2020. https://www.pewresearch.org/politics/2018/04/26/6-quality-and-responsiveness-of-elected-officials/.
Person. “Factbox: Inflation, Abortion Top Issues for U.S. Voters Casting Midterm Ballots, Exit Poll Finds.” Reuters. Thomson Reuters, November 8, 2022. https://www.reuters.com/world/us/inflation-abortion-top-issues-us-voters-casting-midterm-ballots-exit-poll-finds-2022-11-08/.
Published: Nov 11, 2022. “Analysis Reveals How Abortion Boosted Democratic Candidates in Tuesday’s Midterm Election.” KFF, November 11, 2022. https://www.kff.org/other/press-release/analysis-reveals-how-abortion-boosted-democratic-candidates-in-tuesdays-midterm-election/.
Silver, Nate. “Candidate Quality Mattered.” FiveThirtyEight. FiveThirtyEight, November 9, 2022. https://fivethirtyeight.com/features/candidate-quality-mattered/.
Ward, Myah. “The GOP’s Last ‘Candidate Quality’ Test.” POLITICO. Accessed December 5, 2022. https://www.politico.com/newsletters/politico-nightly/2022/09/13/the-gops-last-candidate-quality-test-00056533.