on
Blog 8: Final Prediction
TLDR; If you read nothing else, my model predicts that democrats will win approximately 46.84% of the two party vote share while Republicans will win 53.16% of the two party vote share for the House midterm election in 2022.
Hi everyone! We’re back this week and ready for election day! This is the last stop on my election prediction journey and so I will take the time to synthesize my findings from the past 7 weeks to formally supply an estimation of the two party vote share outcome for the 2022 midterm elections. Today, I will walk you through every step of my process from variable consideration, to model evaluation, to prediction. I hope through reading this blog you will be able to understand how I’ve thought through the election and ways to make a robust model.
To start, after trying numerous methods, I decided to maximize interpretability and robustness of data by doing a national level model instead of a district level model. While doing a district level model definitely has some benefits when coming to predict seat share, I valued having a larger sample size to work with in my data over other advantages. My district level model data felt sparse which I think would hurt its predictive power when it encounters new data. As such, my model aggregates all variables on a national scale for a two party vote share prediction.
The model predicts the dependent variable of Democratic Two Party Vote Share based on 5 predictors:
Average Expert Prediction Rating: the average expert rating of the political lean of a district (1-solidly Democratic - 7 solidly Republican)
Generic Ballot Democrat Percentage: the average generic ballot for democrats reported within 30 days of election
Incumbent Democratic President: an indicator variable (1 or 0) that is 1 when the sitting president is a Democrat and 0 otherwise.
Democratic Seats to Defend: the number of seats the democrats currently hold in the house
Turnout: the percentage of voters that cast a vote in a given district

Strategic and Academic Considerations
When determining these 5 variables as my predictors, I think my main focus was creating a model that balanced being accurate on train data and being generalizable on new data like the uncertain midterm election. As such, I focused most on understanding how my model could capture the variation in elections holistically by looking at major themes across all elections but most importantly the 2022 midterm.
From reading contemporary articles about how voters are framing this election, very little has to do with each individual candidate’s plans for their constituents and centers much more on the dynamics between the two party’s. According to recent research conducted by the pew research center, voters feel both Republican and Democrat candidates have done an incredibly poor job at explaining their plans for the country. Instead, the election has been framed much more about how voters feel about the Democrat party remaining in control as they have since 2020. As such, most of the predictors I chose worked to shape or help explain voters views on the Democratic party. For instance, I included the indicator variable that represented when a president is currently a democrat or not. This variable allows my model to capture the influence of having a sitting democrat president on voter sentiment. Traditional theorists believe that oftentimes people’s votes for a sitting President’s party in midterms reflects their opinions of the status quo and so the party absorbs this sentiment in downballot races like the house. (Skelley and Rakich) Similarly, incorporating the results of generic ballots close within 30 days of an election allows me to have my model include a general temperature check of people’s feelings about the party close to election day and measure its impact on election day party vote share.
It is important to note that I had significant limitations on the amount of data I personally had access to. Since I fundamentally believe in the wisdom of crowds, I decided to make average expert rating a predictor in my variable. Experts forecasting elections and party lean have access to data behind pay walls and more advanced research methods. In addition, their models incorporate more advanced techniques and niche data that were beyond my capabilities to use and access in this course. As such, I found aggregating multiple expert forecasts on district lean served to be a helpful variable to try in my model. While at first I was skeptical about the potentially black box nature of this predictor, week after week it has performed well in my model and I feel pretty confident having the humility to defer to expert predictions in this sphere will serve me well in my final prediction.
Additionally, I included turnout and number of seats the Democratic Party had in the house to defend in an election. While turnout typically has a statistically minimal effect, in tight races I do believe it will be important for Democrats looking to boost party vote share. Looking at correlation it has been After reading a paper by John T. Wooley, I was positively encouraged by the capability of current democratic seats in the house to explain election outcomes. Hist theory posits that the larger the number of seats that the party has currently to defend, the less successful they will be and the lower the their party vote share might be. For starters, with finite resources party’s can only support so many candidates successfully and more importantly, the fewer seats the party holds the fewer it has to lose.
All in all, holistically looking at historical literature and contemporary writings that posit the narrative of this midterm election have significantly contributed to my choice of predictors for this final model. Since I explained some of the theory behind their selection, I figured it would similarly be helpful to see the correlation of each variable on its own to party vote share. As such, I plotted each predictor against two party vote share in the graph below.
Examining Predictor Relationships Individually
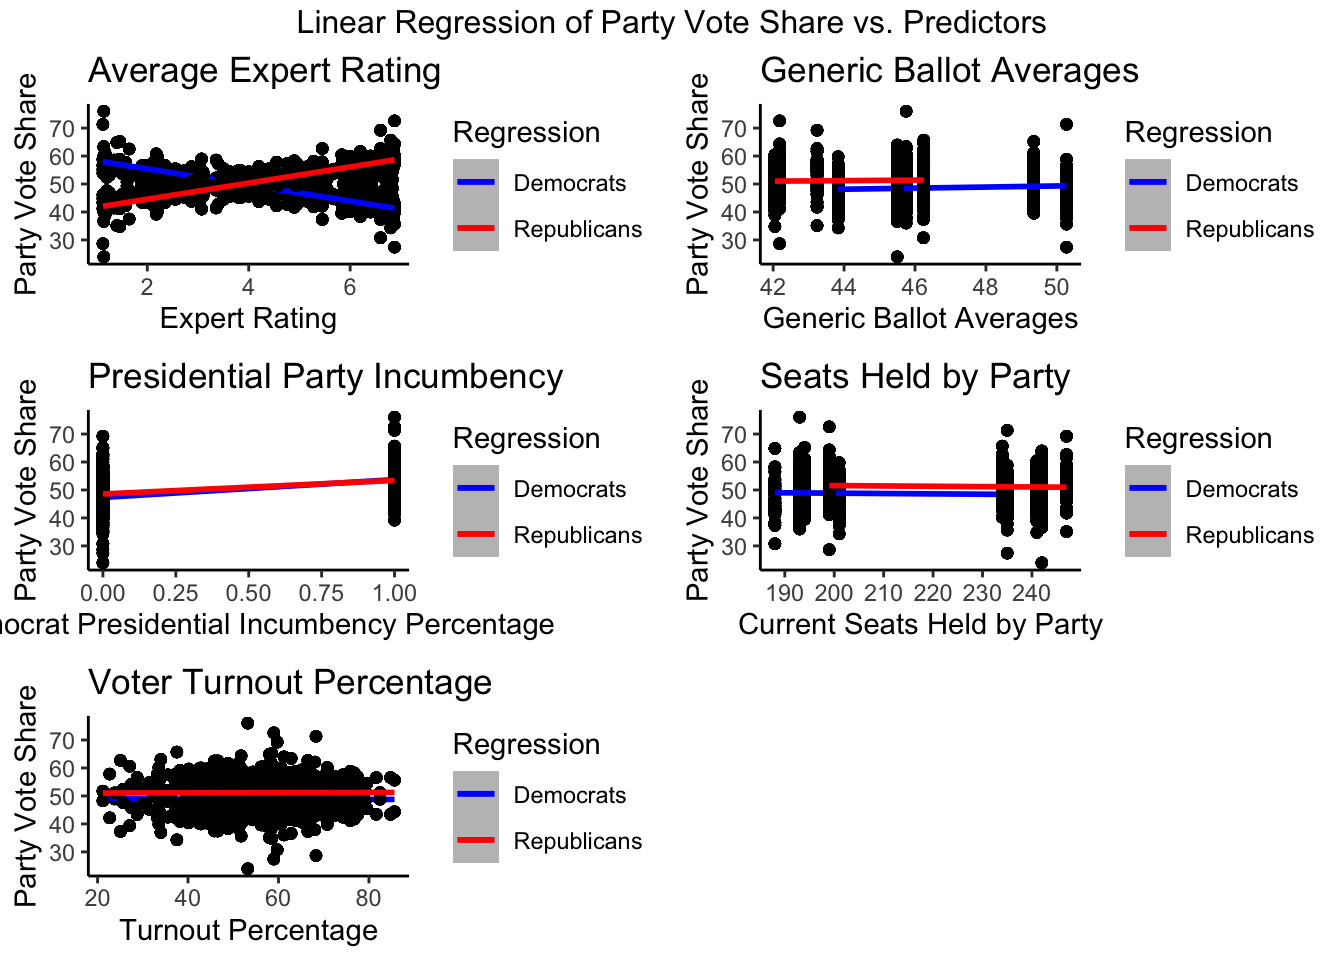
In the graph above, each predictors in my model can be seen and regressed against two party vote percentage for each party on its own. A few interesting trends and cautions can be gleaned from the above plot. Average expert rating seems to have a very clear and strong correlation likely due to the ordinal nature of the variable. As expert rating approaches 7, the republican vote share increases and as it approaches 1 democratic vote share increases. Similarly, both Republicans and Democrats see a decrease in party vote share when they hold more seats to defend in the house. Unfortunately, voter turnout does not seem to have a ver strong correlation with party vote share on its own. Finally, since presidential party incumbency status is a binary variable, the linear regression graph does not appear to display the influence very well although there does appear to be presidential party incumbency advantage (perhaps this has to do with both midterm and election years being included). All in all, these regression plots do reduce some of my confidence in the variables I’ve chosen individually but I do believe in tandem they can be very descriptive of the election.
Model Results
##
## ===========================================================
##                                     Dependent variable:
##                                 ---------------------------
##                                 Democratic Vote Percentage
##                                  Final Election Prediction
## -----------------------------------------------------------
## Expert Rating                        -3.059*** (0.029)
## Generic Ballot Democrat Percent      0.459*** (0.021)
## Incumbent Democrat President         -0.644*** (0.123)
## Dem Seats                            -0.064*** (0.003)
## Turnout                              -0.044*** (0.004)
## Constant                             55.546*** (0.881)
## -----------------------------------------------------------
## Observations                               5,795
## R2                                         0.761
## Adjusted R2                                0.761
## Residual Std. Error                  2.878 (df = 5789)
## F Statistic                     3,694.777*** (df = 5; 5789)
## ===========================================================
## Note:                           *p<0.1; **p<0.05; ***p<0.01
As can be seen in the stargazer above, every variable is significant at the 99% confidence interval with a p-value less than 0.01.
Average Expert Prediction Rating: In my model, average expert rating has a coefficient of -3.059. This can be interpreted as for any increase in one point of expert rating, the predicted Democratic Two Party Vote Share Percentage decreases by -3.059. This makes sense since an increase in a point on the scale of expert ratings increases the experts confidence in how solidly Republican a region is.
Generic Ballot Democrat Percentage: In my model, generic ballot democrat percentage has a coefficient of 0.459. This can be interpreted as for every increase in 1 percentage for the average democrat percentage of generic ballots taken with 30 days of the election, there is an approximate 0.459 increase in Democratic Vote Share Percentage. This makes sense since
Incumbent Democratic President: In my model, the incumbent democrat president variable (dem_status) has a coefficient of as a coefficient of -0.644. This means that if a sitting president is a Democrat, then the house Democratic Two Party Vote Share will approximately decrease by 0.644 percent. Given the nature of midterm elections, which are often referendums on the sitting president and his status quo, this negative coefficient makes sense.
Democratic Seats to Defend: In my model, the democratic seats to defend variable (dem seats) has a coefficient of -0.064. This means that for every additional seat the democrats currently hold and must defend in the house, their Democrat Vote Share percentage will decrease by approximately 0.064.
Turnout: In my model, the turnout variable has a coefficient of -0.044. This means that for every increase in one percent of turnout the democratic vote percentage decreases by -0.044 percent. While this coefficient does seem dubious given the small positive correlation between turnout and democratic vote share, in conjunction with the rest of my model perhaps turnout is being used to adjust vote percentage along with other variables.
MODEL PREDICTION
Ultimately, the goal of creating the model is to then predict the outcome of tomorrow’s 2022 midterm election in the house. As discussed earlier, I aim to predict two party vote share in the house. After wrangling the data for 2022 as of 11/07, my model predicts that democrats will win approximately 46.84% of the two party vote share while Republicans will win 53.16% of the two party vote share for the house. At a 95% confidence interval, my model’s lower bound for democrat vote share percentage is approximately 41.2% while the upper bound is 52.49%. While this prediction may seem wide, it does seem on trend with the conversation going on in the election world even as of today. According to today’s New York Times article, the election seems incredibly close and could swing either way despite a significantly easier path to House dominance by the Republican party. As such, I think this model’s conclusion is fair and a likely outcome. However, to more formally analyze the validity of this model I used both in sample and out of sample metrics of evaluation.
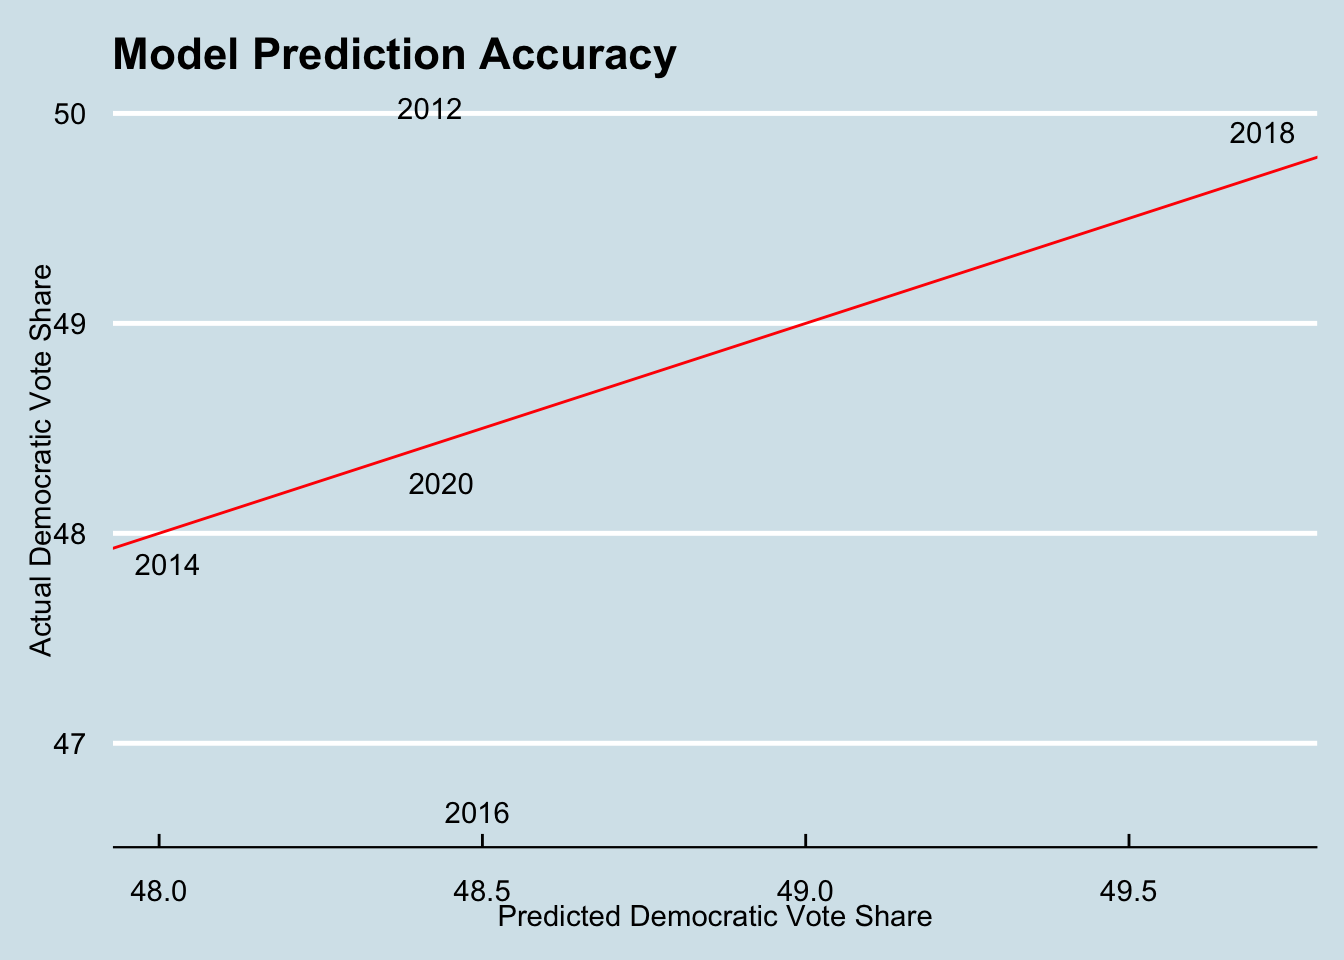
First off, looking at my model, it has an adjusted r-squared value of 0.761. While this is not a perfect r-squared, I do have confidence in the model’s ability to predict off the data fairly well. In examining my models predictive capabilities, I graphed a plot of the models predictions on the training data against the actual values of Democratic vote share. As can be seen, the model looks very accurate for midterm years like 2014 and 2018, as well as 2020. The years where this model strayed from the data was in 2012 and 2016. I’m not surprised by the degree to which 2016 is off since my model is based significantly on polls and expert predictions, which proved incredibly fallible in the 2016 election. As such, I continue to have confidence in my models predictions and am encouraged by the models accuracy during midterm years in the data set.
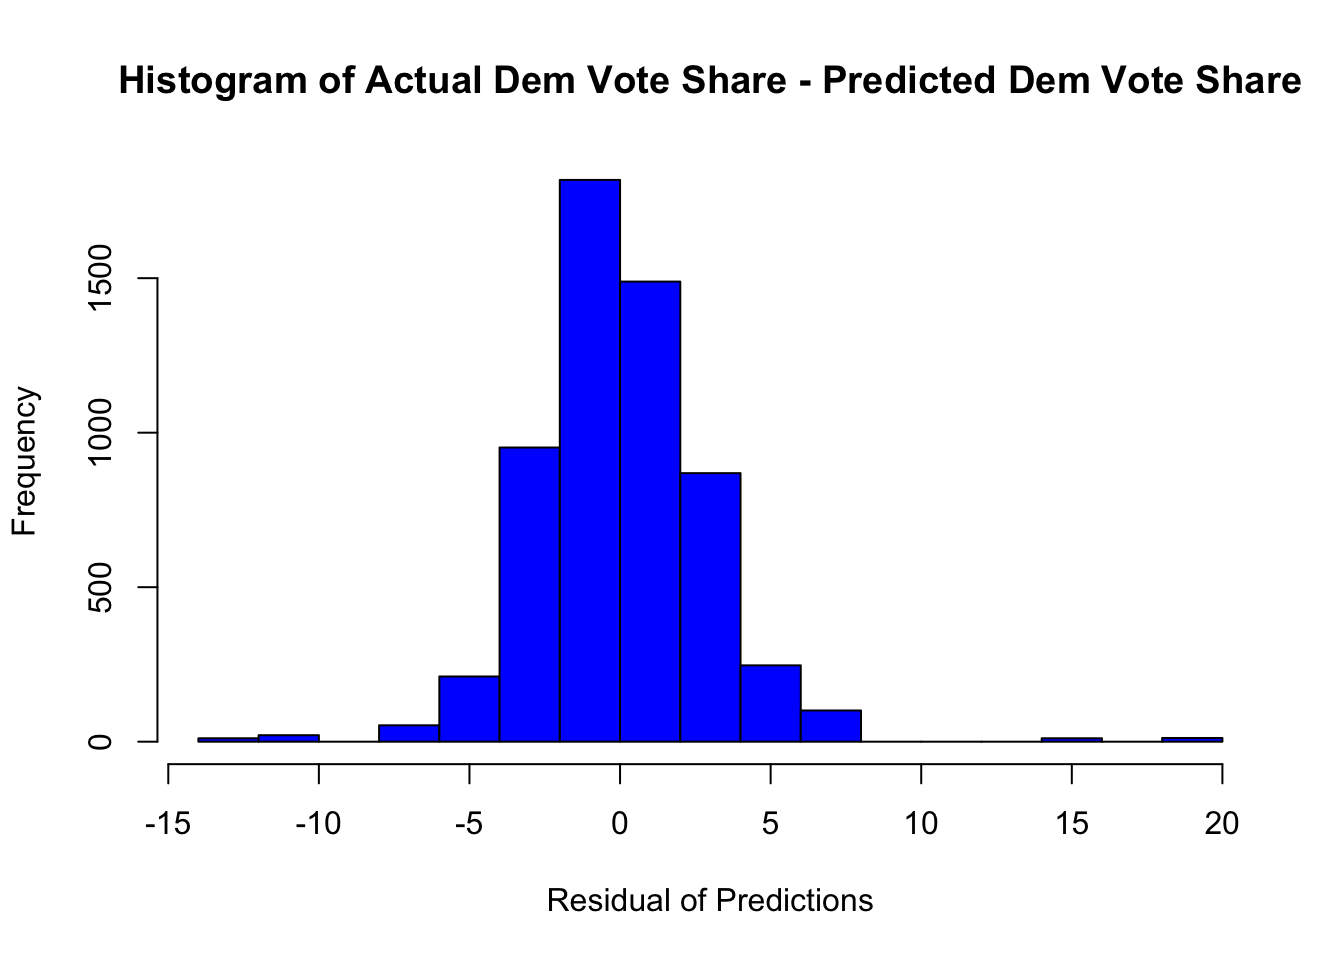
Additionally, in evaluating the in-sample errors in the model I checked to make sure there wasn’t any significant skew. Looking at a histogram of the residuals below, I can see that the errors are approximately normally distributed. Since normality of residuals is an assumption of a linear model, this proves the assumption valid for my national level model and gives me more confidence in my linear model predictions.
In addition to conducting in-sample evaluation, I also conducted out of sample evaluation in order to evaluate my model and its sensitivity to given data points. Looking at cross validation error, my model had approximately 1.58124, which while not optimal is much lower than many of my other previous models.
LIMITATIONS
Overall, my largest limitation was definitely sample size. Statistics has shown time and time again that with small sample size comes increased bias and weaker models. House election data is very hard to find and even more so on a district level. My model got limited by the average expert predictions variable which didn’t have data points before 2010. As such, my model didn’t have enough elections to train on. This is one of the reasons I chose to use a national level model that aggregates district data into one prediction model rather than a district level model that contains an individual predictive model for each district and then aggregates each prediction, as each district only had 1-2 data points. Additionally, since my data predicts overall two party vote share, who actually controls the House and by how many seats could be different from dominance in my prediction. Without clear means for accounting for redistricting in my national level model, I felt efforts to tackle seat share predictions may not be sufficient or valuable. Overall, I’m proud of what I have put together but am incredibly cognizant that my models predictive power could be higher.
CONCLUSION
All in all, I’m eagerly awaiting election results and do believe my model has accurately predicted Republican dominance of the two party vote share. In reflecting on my model, I chose to present my national level prediction in its simplest form rather than one of my more technically advanced or flashy models made such as a pooled district model. Following the advice of Gary C. Jacobson, I chose to go for a simpler more robust model rather than a technical but data sparse model. I hope I made the right choice but looking at my final predictions of 46.84% for the Democratic Two Party Vote Share versus the 53.16% for Republicans, I feel fairly confident in the results. Ultimately, looking at the themes of this election, it feels as thought decisions are going to be made by reviewing sentiments towards the Democratic Party in the past two years instead of on a candidate by candidate or race by race basis. I look forward to evaluating this theory post election day and dissecting the psychological components and motivators behind the electoral outcome soon.
CITATIONS:
Geoffreyvs. (2022, January 3). Why the president’s party almost always has a bad midterm. FiveThirtyEight. Retrieved November 7, 2022, from https://fivethirtyeight.com/features/why-the-presidents-party-almost-always-has-a-bad-midterm/
Jacobson, Gary C. “ The 2022 U.S. Midterm Election: A Conventional Referendum or Something Different ?” Dropbox, University of California, San Diego, https://www.dropbox.com/s/95s7hip8bzg5x8n/Jacobson%202022%20Essay.pdf?dl=0.
Schaeffer, K., & Green, T. V. (2022, November 3). Key facts about U.S. voter priorities ahead of the 2022 midterm elections. Pew Research Center. Retrieved November 7, 2022, from https://www.pewresearch.org/fact-tank/2022/11/03/key-facts-about-u-s-voter-priorities-ahead-of-the-2022-midterm-elections/
“The 2022 Midterm Elections: What the Historical Data Suggest.: The American Presidency Project.” The 2022 Midterm Elections: What the Historical Data Suggest. | The American Presidency Project, 30 Aug. 2022, https://www.presidency.ucsb.edu/analyses/the-2022-midterm-elections-what-the-historical-data-suggest.