on
Blogpost 7: Shocks
Hi everyone! We’re back this week with and just two weeks out from election day! This week we covered a lot of topics but especially shocks! Shocks are bound to happen in any election for many reasons, whether it be the volatility of the economy, foreign policy events, or personal scandals brought to light by the media. The very nature of elections is unpredictable and shocks are bound to happen, hence the infamous “October Surprise”. I posited quite a few ways to include shocks in my model, but ultimately the expectation that shocks are regular in every election cycle and the inherently incalculable nature of the effect of specific shocks made me rule out including any additional calculation or variable for shock in my model. I believed that any significant way by which they should be calculated would be baked into expert models that are in my expert prediction variable so any additional fitting to shock would be counter intuitive and possibly overfit the model to shock.
As such, moving towards a final prediction this week the big question I aimed to investigate was: What additional variables remain unexplored that could allow my model to better forecast the 2022 midterm elections?
WHY I DIDN’T USE A POOLED MODEL? To start off, I want to address this weeks extension. I debated putting together a pooled model for this week but I realized a few reasons why it may not be worth it. First off, a pooled model works best when borrowing data from districts that have more data have the possibility of supporting districts with less data. However, the variation of the amount of data for each district was never more than 3 data points. Since every district had so few data points, borrowing data doesn’t get me much farther than I was before. Additionally, the problem with my district level model over all is that the data is just so scarce that the model is not really generalizable. As such, I chose to forgo creating a pooled model in favor of exploring other predictors.
To being my discussion of this weeks new models, I wanted to illustrate the best models from last week. After testing measures of turnout in national and district-level models, I determined my best national models predicted two party vote share by using measures of turnout, average expert prediction, and party presidential incumbency. In addition, I ran this model on all election years in the data set as well as on just the midterm election years. The regression results in the table below illustrate the success of the model. As can be seen, the model performed better on the midterm election data set than on the whole data set but that is likely due to smaller sample size of the midterm election dataset.
##
## =========================================================================
##                                        Dependent variable:
##                         -------------------------------------------------
##                                       DemVotesMajorPercent
##                         All election years model   Midterm years model
##                                   (1)                      (2)
## -------------------------------------------------------------------------
## Turnout                     -0.022* (0.012)          0.117*** (0.020)
## Expert Rating              -3.184*** (0.107)        -2.723*** (0.134)
## Incumbent Dem President    -1.663*** (0.417)          -0.568 (0.579)
## Constant                   64.000*** (0.913)        55.459*** (1.333)
## -------------------------------------------------------------------------
## Observations                      489                      209
## R2                               0.722                    0.776
## Adjusted R2                      0.720                    0.772
## Residual Std. Error         3.230 (df = 485)         2.630 (df = 205)
## F Statistic             419.203*** (df = 3; 485) 236.206*** (df = 3; 205)
## =========================================================================
## Note:                                         *p<0.1; **p<0.05; ***p<0.01
As I feel pretty good about these linear models in forecasting, I want to use the model as a base for my final model and take this week to investigate whether a few other variables serve as strong predictors within this already successful framework. After doing extensive research, it appears that number of contested seats for a party in the election has some correlation with vote percentage. Traditional academic wisdom describes an inverse relationship between number of seats a party must defend and their vote percentage. To investigate this on my own, however, I plotted the regression for both the democratic and republican party on number of seats to defend and party vote share. The plot is pictured below.
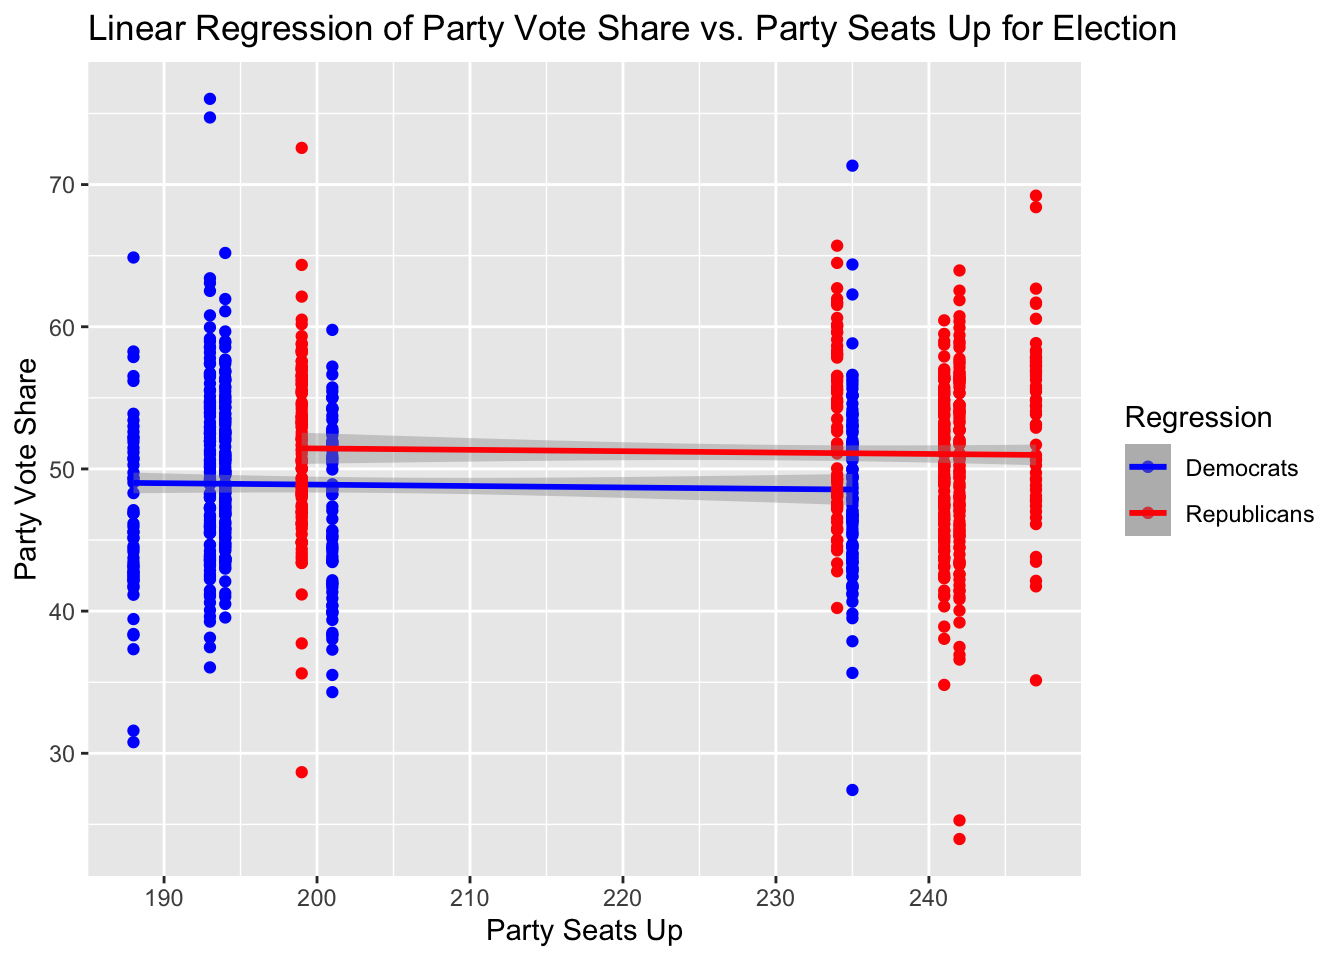 As illustrated above, while small, there is a small negative correlation between party vote share and number of seats up for contest. My concern is that this correlation is small so that include seat share in my model will not have much of an effect. To test this theory further, I added number of seats a party has up for election into my model. Thus my model is meant to predict Democratic Vote Share through using average of expert predictions, turnout, whether a sitting president is a Democrat, and the number of seats the democrat hold in the house right now. The results of the model are illustrated in the table below.

As can be seen in the models above adding in seats does improve both the r-squared and adjusted r-squared measures of the model. In the first model, I just added the number of democratic seats as an addition variable to my base model. This yielded an adjusted r-squared value of 0.737 which is a marginal improvement on the adjusted r-squared value of 0.720 from my previous national model tested on both midterm and presidential election years. Interestingly, in the model, the incumbent president variable decreased in significance. Additionally, I thought especially for midterm elections that whether the sitting president is from a specific party might have influence on the effect of seats to defend in the house. As such, I created a second model that is the same as the first but now includes an interaction term between number of democratic seats to defend and the incumbent president variable. This interaction term is somewhat significant with a p-value less than 0.05. The resulting model has the highest adjusted r-squared of an national level model tested on all election years that I’ve made. However, this model is only mildly 0.03 more in adjusted r-squared than the one with just seats alone. Moving forward, I’m going to look at the tradeoffs of generalization versus accuracy in these models to decide on which to use.
After this examination, I wanted to look at one more variable that could be a potentially valuable predictor in my model: committee campaign finance. I wanted to look into campaign finance by party close to the election as money is a physical committment to supporting a party or individual. I believed that seeing the amount of energy measured via financing for a party would help me predict party vote share better closer to an election. While originally I wanted to look at the amount of money each party committee raised in the 30 days closest to the election, the only data I could find was total money raised by each party’s national committee. Using this variable, I made a model predicting Democratic Vote Share with turnout, average expert rating, democratic president incumbency status, number of seats the democratic part holds, and DCCC total funding for congressional races. The summary of the model is depicted in the table below.
##
## Seats Linear Models Regression Results
## ===================================================
##                             Dependent variable:
##                         ---------------------------
##                         Democratic Vote Percentage
## ---------------------------------------------------
## Turnout                       0.044** (0.022)
## Expert Rating                -3.132*** (0.118)
## Incumbent Dem President       -0.441 (0.511)
## Dem Seats                      0.033 (0.059)
## DCCC Funding                 0.010*** (0.004)
## Constant                    51.826*** (12.091)
## ---------------------------------------------------
## Observations                        373
## R2                                 0.736
## Adjusted R2                        0.732
## Residual Std. Error          3.198 (df = 367)
## F Statistic              204.442*** (df = 5; 367)
## ===================================================
## Note:                   *p<0.1; **p<0.05; ***p<0.01
As you can see in the above model, the adjusted r-squared decreased in comparison to previous models. Once again, financing proves to be a week predictor of party vote share and is not an effective predictor in my models. I am glad, however, that I was able to rule out the predictor one and for all.
Using my simple model that included democrat seat number in the house(without the interaction term), my prediction is that the Democrats will win approximately 47.6% of the vote.
In conclusion, for my final model seats held by a given party does prove to be an important predictor. This improves my model and I will take it in the future. Similarly, after evaluating accessible metrics of financing, I can’t find any that prove to be effective predictors of party vote percentage or electoral success. In future analyses, I’m curious if having the right metric would make the variable more predictive or if monetary contributions in general is not really what makes a successful campaign. Perhaps campaigns only need to meet a certain monetary threshold and anything after is helpful but not necessary for changing electoral outcomes. All in all, I’m glad I took this week to do some additional inquiry with various variables to discover and rule out more of them as effective predictors of elections.
Citations: “The 2022 Midterm Elections: What the Historical Data Suggest.: The American Presidency Project.” The 2022 Midterm Elections: What the Historical Data Suggest. | The American Presidency Project, 30 Aug. 2022, https://www.presidency.ucsb.edu/analyses/the-2022-midterm-elections-what-the-historical-data-suggest.
“House Party Committees’ Sources of Funds, 1999-2018.” Campaign Finance Data, http://www.cfinst.org/data.aspx.
Jacobson, Gary C. “ The 2022 U.S. Midterm Election: A Conventional Referendum or Something Different ?” Dropbox, University of California, San Diego, https://www.dropbox.com/s/95s7hip8bzg5x8n/Jacobson%202022%20Essay.pdf?dl=0.