on
Blogpost 2: Economic Fundamentals
Hi everyone! Welcome back to my election analytics blog. This week I am looking at pure economic factors and trying to understand the age old question: Does the status of the economy influence the vote share of incumbent party candidates during elections? Scholars have argued for decades about the extent to which candidates are rewarded or penalized for the status quo of the economy during elections. The traditional thesis that has prevailed is that incumbent candidates party vote share increases when the economy is doing well but decreases when the economy is doing badly. However, recently scholars, like John R. Wright in his 2012 paper Unemployment and the Democratic Electoral Advantage, contend that this may not always be true. Even more debated among scholars is perhaps which economic metrics voters may use to evaluate incumbents during the election. Some believe indicators like GDP that capture national health are more important to voters, while others argue that measures of disposable income that are felt more tangibly in daily life is what is actually used by voters to evaluate candidates. Therefore, today I want to investigate whether more personalmetrics of economic success like RDI are more predictive of voting behavior than nationalized generic metrics of economic success like GDP? This will help me gain some insight into the impact of economic fundamentals on voting behavior and allow me to consider which variables I will want to include in my final model.
To begin, I first had to do some data cleaning and filtering. After reading Healy and Lenz’s 2014 paper, I realized that voters do use the end heuristic to evaluate an incumbents success. Using this logic, I limited the GDP and RDI data to the change in growth from Q8-Q7 before the election cycle. Then, to evaluate the influence of each economic factor on the incumbent party’s two party vote share, I made to linear regression models. The first is the regression of incumbent party vote share on gdp growth from Q7 to Q8. The second is a the regression of incumbent party vote share on rdi growth from Q7 to Q8. The output of the regression models can be seen in the table below.
##
## ============================================================
##                                Dependent variable:
##                       --------------------------------------
##                             Incumbent Party Vote Share
##                            GDP Model          RDI Model
##                               (1)                (2)
## ------------------------------------------------------------
## GDP Growth Percentage       -0.912*
##                             (0.520)
##
## RDI Growth Percentage                           -0.796
##                                                (0.609)
##
## Constant                   52.424***          52.578***
##                             (0.656)            (0.760)
##
## ------------------------------------------------------------
## Observations                  37                  31
## R2                           0.081              0.056
## Adjusted R2                  0.054              0.023
## Residual Std. Error     3.270 (df = 35)    3.400 (df = 29)
## F Statistic           3.071* (df = 1; 35) 1.713 (df = 1; 29)
## ============================================================
## Note:                            *p<0.1; **p<0.05; ***p<0.01
As can be seen in the regression table, the adjusted r-squared value for both models are incredibly low. This means that both models lack predictive power. Looking at the individual covariates of GDP growth percentage and RDI growth percentage from Q7 to Q8, GDP Growth percentage has a higher p-value than RDI growth percentage but neither have a p-value below 0.05. This means that both variables are not statistically significant predictors of Incumbent Party Vote Share. These regression results make me very skeptical of the traditional wisdom that economic factors are clearly influencing voter evaluation of incumbent candidates. To look at these regression results more visually, I have plotted the regression and residual graphs for the previous models below.
##GRAPH OF REGRESSION:

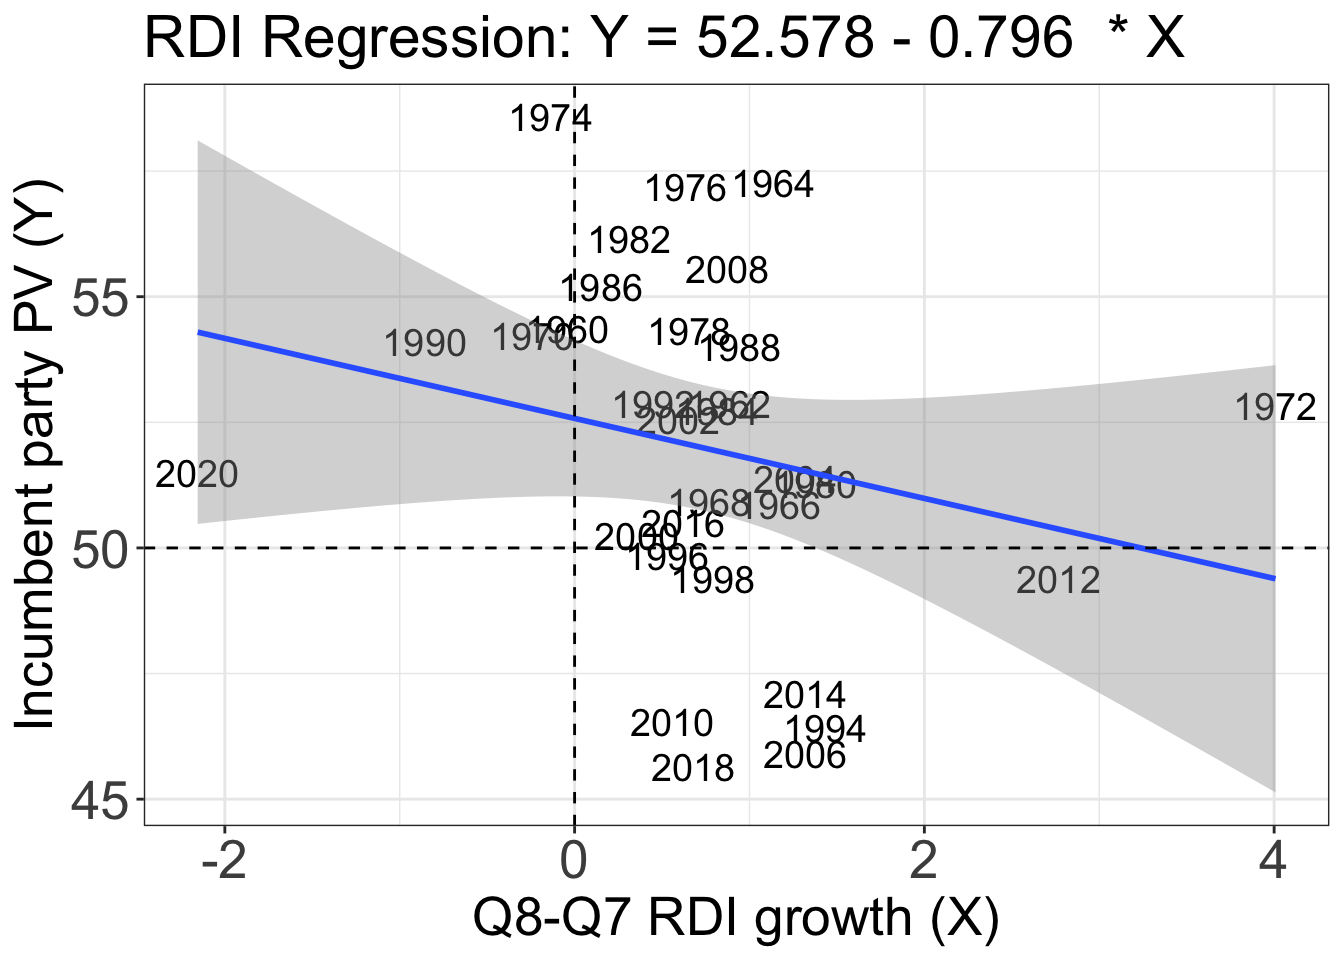 Looking at the graph of the linear regression with data points, it becomes clear that both the GDP change and RDI change regression lines don’t truly fit the data very well. As such, these covariates on their own don’t seem to explain elections very well at all. What is especially intriguing to me is that both of these regression lines have a negative slope associated with the economic indicators growth. This is saying that an improvement in economic indicators from Q7 to Q8 have a negative effect on the incumbent party’s vote share. This seems incredibly counter-intuitive.
Next, lets take a look at the predictions this model yields by graphing the residuals of both the GDP and RDI models.
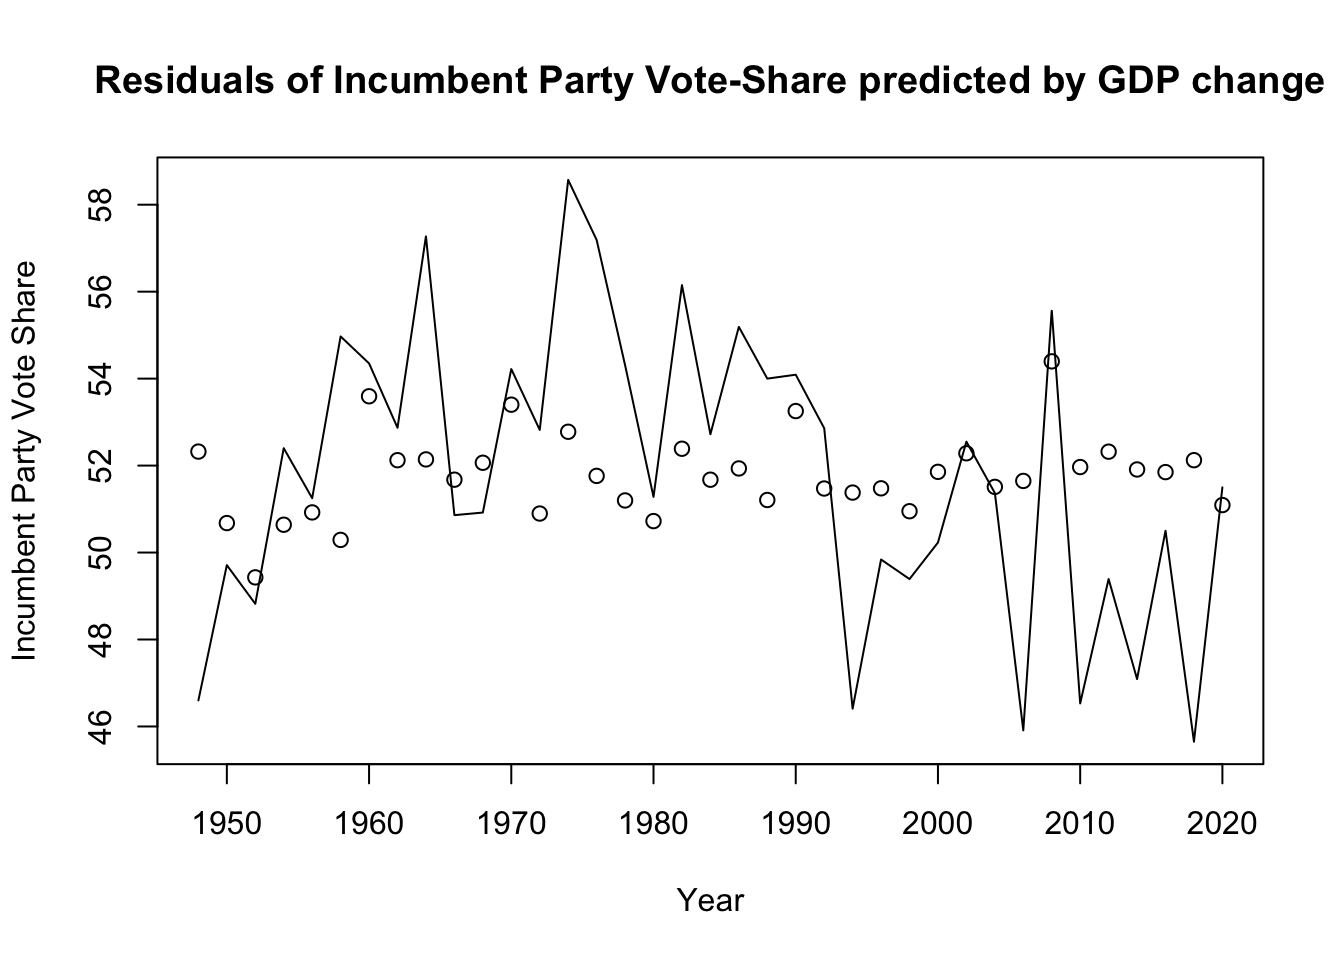
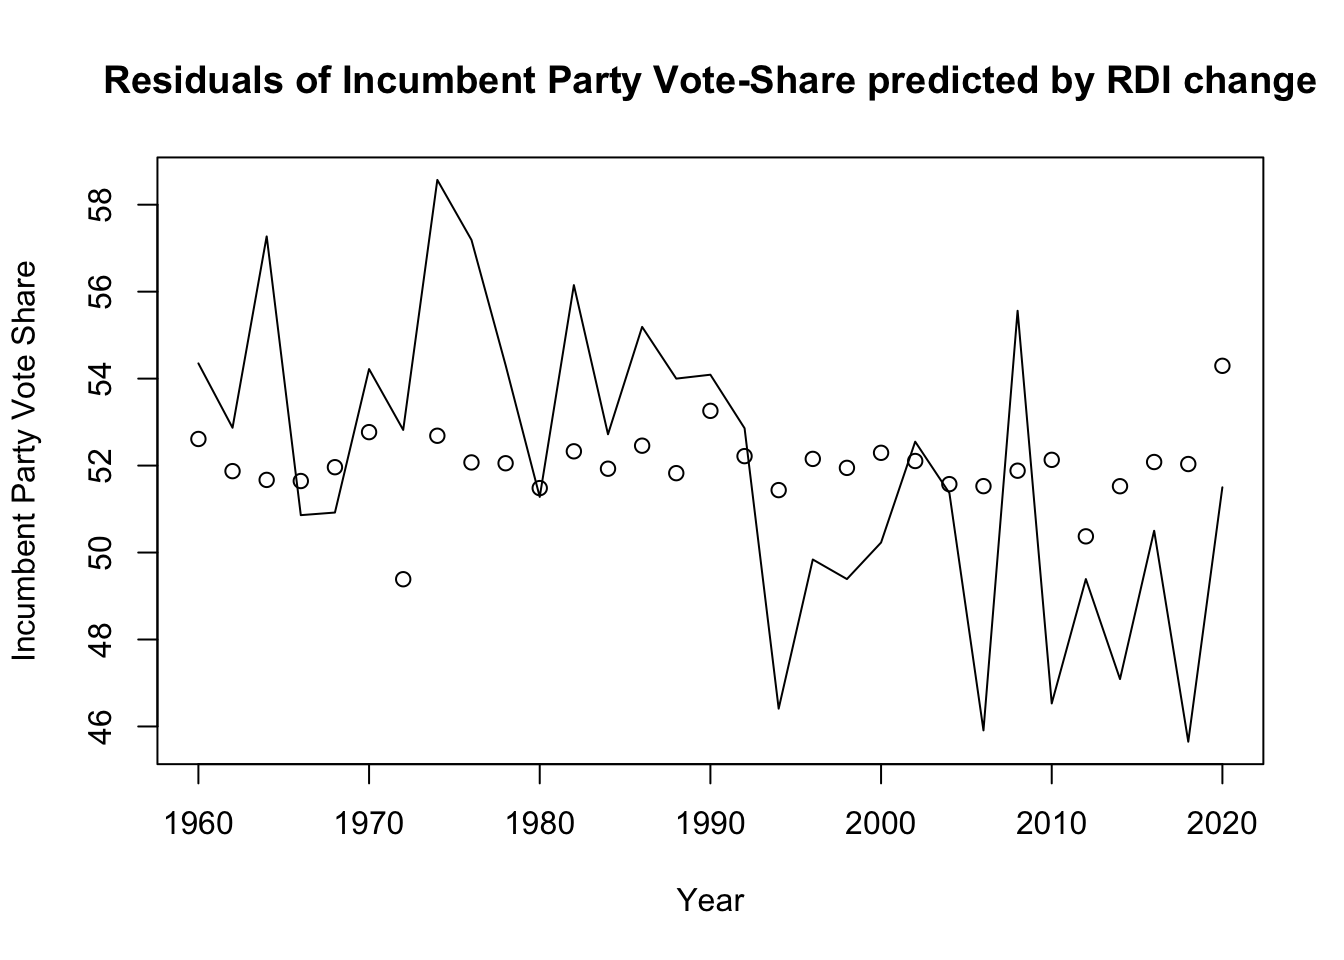
Looking at these graphs, we can once again see that the predictions from the model are fairly far off from the actual data. With points representing the model predictions and line representing actual data, it can be seen that the incumbent party vote share is not well predicted by either the GDP and RDI models. Comapring the two numerically using mean squared error calculations, the RDI model has an mse of approximately 3.289 which is slightly higher compared to that of the GDP model which is approximate 3.180. Thus, in a purely relative sense, GDP seems to be a mildly better predictor of incumbent party vote share than RDI.
All in all, I believe that this makes sense. While RDI is what is more personally felt by people day to day, GDP is what is talked about nationally when reviewing an economy. In press and news coverage, GDP is almost always the measure discussed when talking about the nations economic success. As such, perhaps voters are more attached to the measures that align with media coverage that creates the perception of economic health rather than the actual economic metrics of health.
In understanding why both RDI and GDP are ineffectual in predicting incumbent party vote share, I think Wright in his 2012 paper may have a revealed a key insight. When Wright looked at unemployment, he realized it wasn’t the incumbent party that was impacted but purely the democratic party itself. Instead of unemployment being a valence issue, unemployment was a partisan issue that always helped the democratic party. I’m curious if this is true for nearly all economic issues. Perhaps next week, I will get to test this theory by subsetting by republican and democrat instead of just incumbent party and challenger party.
Finally, to yield a prediction this week, I will use a combination model using GDP and RDI to predict incumbent party vote share for the 2022 election.
##
## =================================================
##                           Dependent variable:
##                       ---------------------------
##                       Incumbent Party Vote Share
##                                   RDI
## -------------------------------------------------
## GDP Growth Percentage           -1.188*
##                                 (0.692)
##
## RDI Growth Percentage           -0.500
##                                 (0.614)
##
## Constant                       52.950***
##                                 (0.766)
##
## -------------------------------------------------
## Observations                      31
## R2                               0.146
## Adjusted R2                      0.085
## Residual Std. Error         3.291 (df = 28)
## F Statistic               2.391 (df = 2; 28)
## =================================================
## Note:                 *p<0.1; **p<0.05; ***p<0.01
As can be seen in the summary table of this combination model above, the model has an adjusted r-squared value of 0.146 so is fairly week. Interestingly, GDP and RDI changed over the past quarter both by -0.6% so this will be the data I use as inputs in the model. Using this data, the combination model predicts that the incumbent party in 2022 (the Democratic Party) will receive approximately 53.963% of the two party vote share. However, due to the low adjusted r-squared value I’d take this prediction with a grain of salt.
Next week, I’m really looking forward to investigating other covariates the help enhance the predictive power of my model since the current economic fundamentals don’t seem like great explanations for incumbent party vote share and election outcomes.
CITATIONS:
Christopher H Achen and Larry M Bartels. Democracy for realists: Why elections do not produce responsive government, volume 4. Princeton University Press, 2017.
Andrew Healy and Gabriel S Lenz. Substituting the end for the whole: Why voters respond primarily to the election-year economy. American journal of political science, 58(1):31–47, 2014. ISSN 0092-5853.
John R Wright. Unemployment and the democratic electoral advantage. American Political Science Review, 106(4):685–702, 2012. ISSN 0003-0554.