on
Blog Post 1 Gerrymandering: Tensions of Vote Share and Seat Share
Hi everyone! Welcome to the wild world that will be my Election Analytics blog. Before we get into the nitty gritty, allow me to introduce myself. I’m Julia Blank, a junior at Harvard College studying Government on the Data Science Track with a secondary in Computer Science. In my free time, you can find me writing for Harvard Sports Analytics, dancing with the Harvard Dance Team, or as I sit right now, hunkered down in the basement of CGIS south pondering the niche questions of this midterm election. I’m finally putting some pen to paper thanks to Professor Ryan Enos’ course Election Analytics this semester. So check back in with me each week to stay up to date with my thoughts on elections past and present as we rapidly approach the 2022 election.
For today, I’m looking to the past to inform a bit more about our present. To begin, I’m investigating the question: Given the very real process of gerrymandering, how does vote share and seat share line up in a midterm election? In order to explore this question, I have chosen to look at the election year 2010. 2010 was a unique midterm election that is often referred to as the “Red Sweep”. In 2008, former President Obama took office and the Senate and House of Representatives were all dominated by the Democratic Party. The years between were quite chaotic with the financial crisis and unemployment. Going into the midterm elections, the nation was anxious to see how people would respond to this Democratic dominance in the Presidency and legislature.
To begin to answer the questions on the impact of districting, I first had to look at the vote share across the nation in the election for the House of Representatives in 2010. To do so, I obtained data that illustrates the number of votes Republicans and Democrats received in every district in America. To calculate vote share by party in each state, I took all the districts within one state and calculated a collective vote share margin for Republicans by adding up all Republican Votes and taking it as a proportion of all votes cast for Republicans and Democrats. I then calculated the same vote share for the Democratic Party. In order to see the margin in vote share, I subtracted the Republican Vote Share from the Democrats Vote Share. As such, in the image below you can see that larger margin numbers correspond to red and a stronger Republican party while more negative numbers correspond to a blue and a stronger Democratic party vote share.
knitr::opts_chunk$set(echo = FALSE, message = FALSE, warning = FALSE) ## [1] "AL" "AK" "AZ" "AR" "CA" "CO" "CT" "DE" "DC" "FL" "GA" "HI" "ID" "IL" "IN"
## [16] "IA" "KS" "KY" "LA" "ME" "MD" "MA" "MI" "MN" "MS" "MO" "MT" "NE" "NV" "NH"
## [31] "NJ" "NM" "NY" "NC" "ND" "OH" "OK" "OR" "PA" "RI" "SC" "SD" "TN" "TX" "UT"
## [46] "VT" "VA" "WA" "WV" "WI" "WY"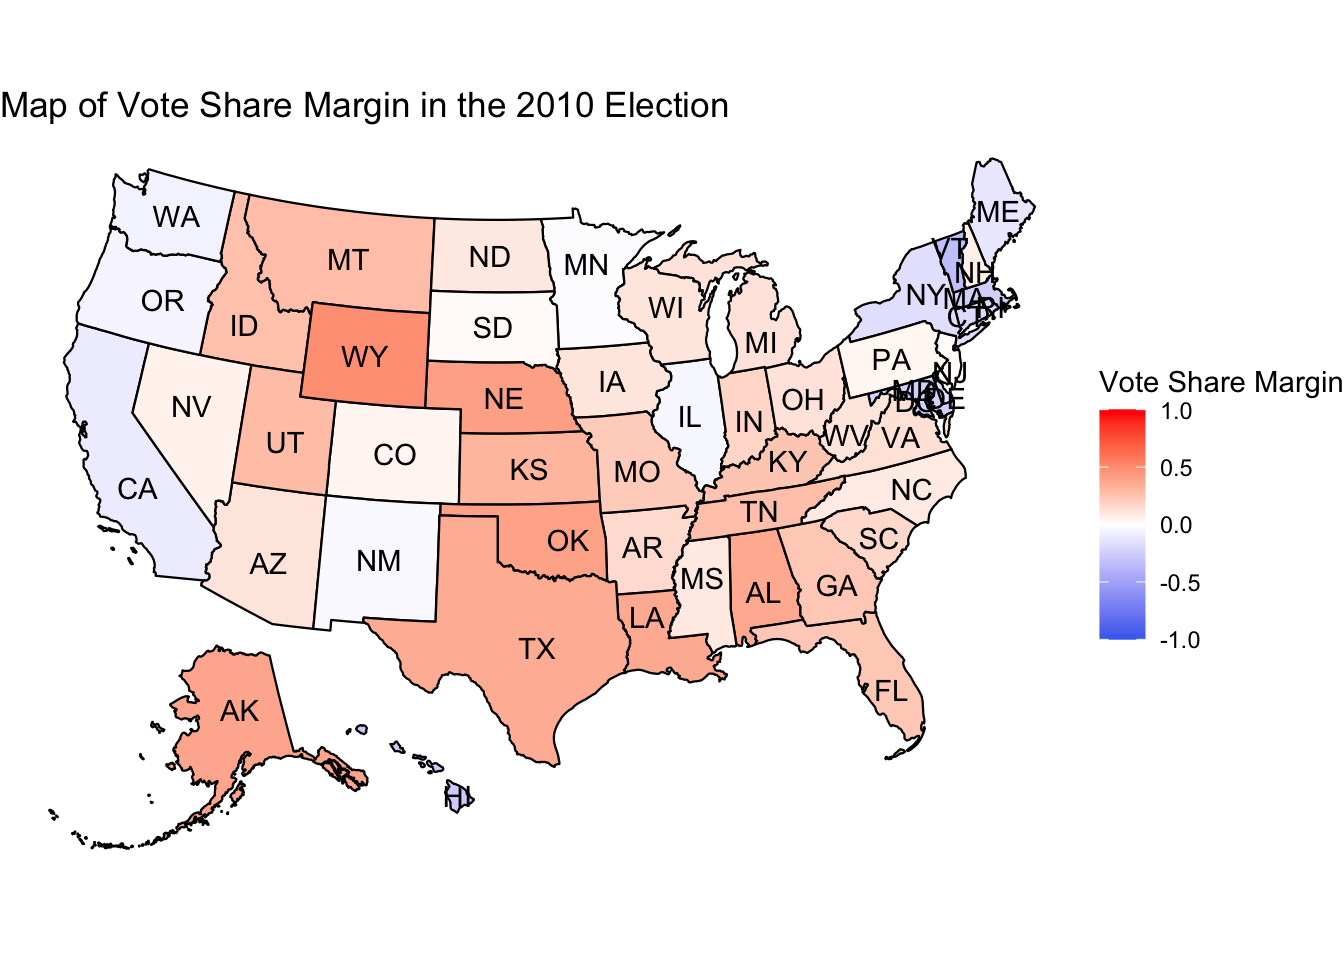
In the image above, we can see a predominately Republican landscape in terms of vote share margin. This “red wave” demonstrates a leading positive vote share margin in favor of republicans in most of the country. There are a few predictable pockets of a Democratic vote share lead in the North East and on the West Coast. Uniquely in this map, while the Republicans swept the landscape the margin in vote share between the two parties never reached a greater magnitude than a 0.5 lead. Such is the nature of our two party system, where one party even if they lead rarely ever leads by a vote share margin of 1.
With the map of vote share margin between the two parties in mind, we can now compare the similarities in the seat share for that very same election. To examine this, instead of looking at the amount of votes each party one we look at the number of seats a party one in a given state. To find the margin of seat share, I subtracted the Republican seat share value from the Democratic seat share value. As such, the corresponding map associates a larger more positive margin value with Republican seat share success and a more negative margin value with Democratic seat share success.
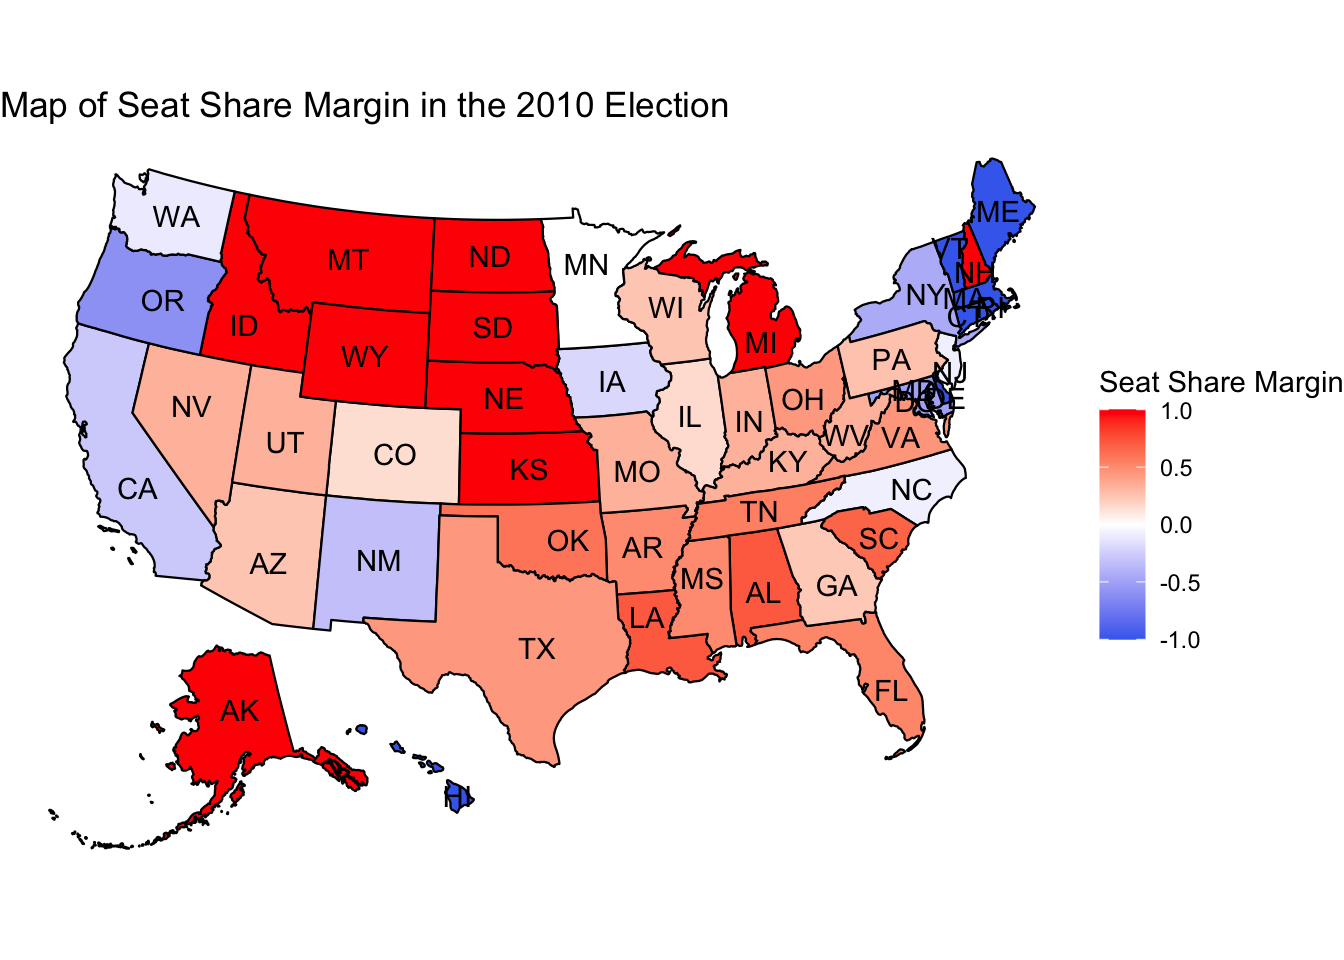 In the map of seat share, the strength of the Republican party seen in the vote share map seems to be even stronger. Uniquely, the colors in this map of seat share margin is much more vivid than that of vote share margin, demonstrating a clear dissonance between the two metrics. While in the map of vote share the Republican party could see small leads in vote share across the nation, the map of seat share demonstrates a stark dominance. Even for the Democratic party, in places where they had slight leads in vote margin like Maine or New Mexico, they ended up receiving a much larger margin of seats for the state.
So, why does this happen? The answer is the unique process of districting and the complexity of Gerrymandering in the US electoral system. Gerrymandering as a process requires drawing and manipulating the boundaries of districts in order to favor a party of another. Through tactics of fragmentation and packing, parties can draw districts to give themselves a seat share advantage. It’s important to note that gerrymandering won’t appear in vote share margins but will impact the seat share. As illustrated by the 2010 maps, the seat share almost always exacerbates the margin of vote share. Numerous states, like Michigan, that only saw small leads in vote share will see massive margins in seat share.
In fact, the very process of Gerrymandering can take a minority party in vote share and make them the dominant party when it comes to taking seats in the house. In the case of 2010, the most notable examples of this are North Carolina and Iowa. Both of these states had a larger Republican vote share margin but flipped to see a larger Democratic margin when it came to seat share. In the case of these states, it is clear that the Democrats were concentrated in a few districts (1, 2, 3) while the Republican majority was strongest in just two districts (4,5). With numerous states flipping party dominance based on the metric chosen, be it vote share or seat share, it is important to note this feature of our democratic system. The result of elections do change quite drastically from vote share as districting transforms these calculations to seat share.
While many argue about the integrity of a system that doesn’t align directly with populations vote share, I won’t in the post sit and pass judgment. However, I do find it important to remark on this as it pertains to my mission this semester. As we go forth together into this election modeling journey, it will be essential for me to both highlight the metrics I’m calculating, acknowledge the limitations of this metric, and explain how it may fit into the broader democratic system.
Citation: “Measuring the Size of Election 2010’s Republican Sweep.” Accessed September 15, 2022. https://www.usnews.com/opinion/blogs/peter-roff/2010/11/05/measuring-the-size-of-election-2010s-republican-sweep.
House general elections, All States, 2010 summary. (2022). CQ voting and elections collection (web site). http://library.cqpress.com/elections/avg2010-3us1
All other data from lab.